The total area of London is c.600 sq mi but a quarter of that area is Green Belt which is never going to be developed. It’s a bit like referring to the total area of New York rather than just the land area. Either way, London has a higher population spread across a wider city administrative area, with a larger amount of undeveloped/green space area than New York. Their urban morphologies have developed in different ways with neither being right or wrong.
One point to note – which I think Muppet touched upon – is that the data collection for the numbers in this thread does come with some caveats. Namely that the US figures are from 2024, whilst those for the Australian, British and Canadian cities are 2021, and that for Paris 2022.
As we will all recall, the pandemic was a rather peculiar time that produced short-term and questionable outputs for census/survey data collection. Arguably the Australian, British and Canadian censuses ought to have been delayed to better reflect the abnormal circumstances of the time. For example the travel to work figures in the British census are completely useless (even the ONS notes this) as millions of people stepped into their study rather than drive, cycle or catch a train into the office or factory. There were also some peculiarities on a national and international migration level where people left (some temporarily, some permanently) to get out of London and find space, only to then come back.
Another point to raise is that the UK, like some other countries, experienced a post-pandemic surge in migration. Net migration to the UK in the 12-months to June 2023 hit at a staggering
906,000. That record breaking number has since fallen to the long-term average, but it wouldn’t be factored into these numbers. London, Toronto and Sydney most likely saw astronomical surges. London’s foreign born population could very well have increased by half a million from the 2021 census to 2024.
Taking Docere’s figures, I crunched some numbers using the London, Île-de-France (Greater Paris), Toronto CMA and Greater Sydney, and New York City (not metro) numbers from the ACS. Everything that follows is based only on
Foreign Born Communities (FBC’s) >5,000 – across the five cities.
In total
133 countries are represented by at least one of these cities. A few interesting comments:
- Paris is the least diverse of the five
- Sydney has the highest concentration amongst the top 3 FBC’s, whilst London the lowest
- Toronto surprisingly has the least number of FBC’s unique to that city
- Across all five cities, China and India total 1.03mn and 1.00mn each. The Philippines is 3rd (416k), Dominican Rep. 4th (378k), and Algeria 5th (369k)
- The are 11 FBC’s represented in all five cities: Brazil, China, Colombia, Germany, India, Italy, Pakistan, Poland, Russia, Turkey and Vietnam
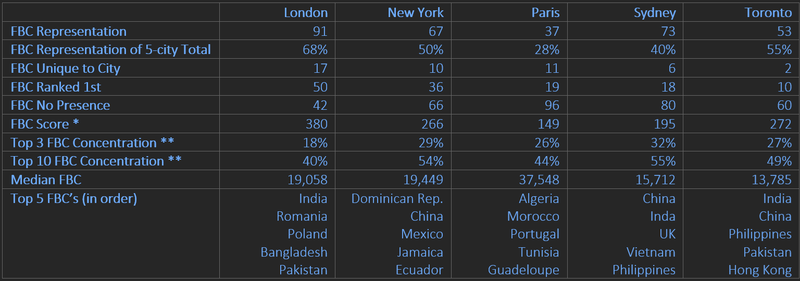
* Simple ranked scoring system of 1st = 5 points, 2nd = 4, etc…)
** Against total foreign born population (inc. <5,000 FBC)




 Threaded Mode