Quote:
Originally Posted by rivernorthlurker

I would love to see the breakdown since there have been some massive high profile 'absorption' during this time like BMO tower, 110 Wacker, and possibly Salesforce. I'mm not sure how/when they count these.
It would be more exciting if the high numbers weren't coming from single massive projects.
Does anyone know what 'completions' are in this context?
|
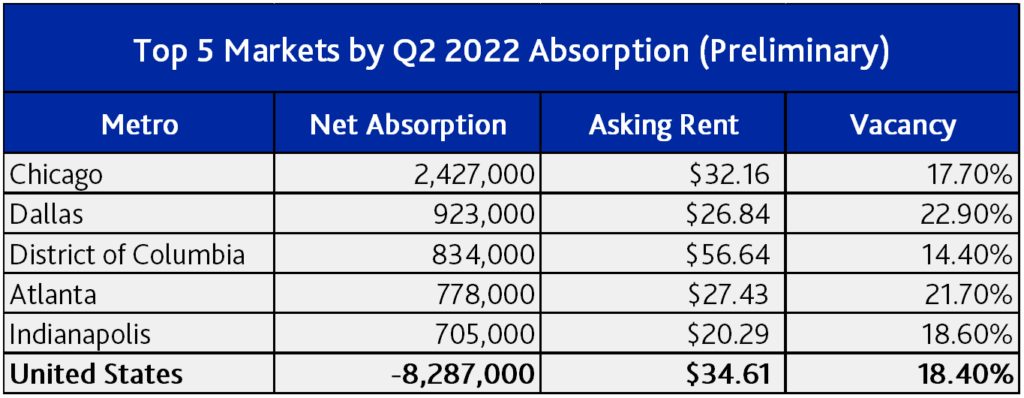
I went through some figures for the downtown area from the Cushman and Wakefield reports. I think some of the data is categorized differently in the Moody’s article and table, but overall the big picture seems the same.
Basically, 110 N Wacker and Fulton Market were the big additional inventory bombs this year
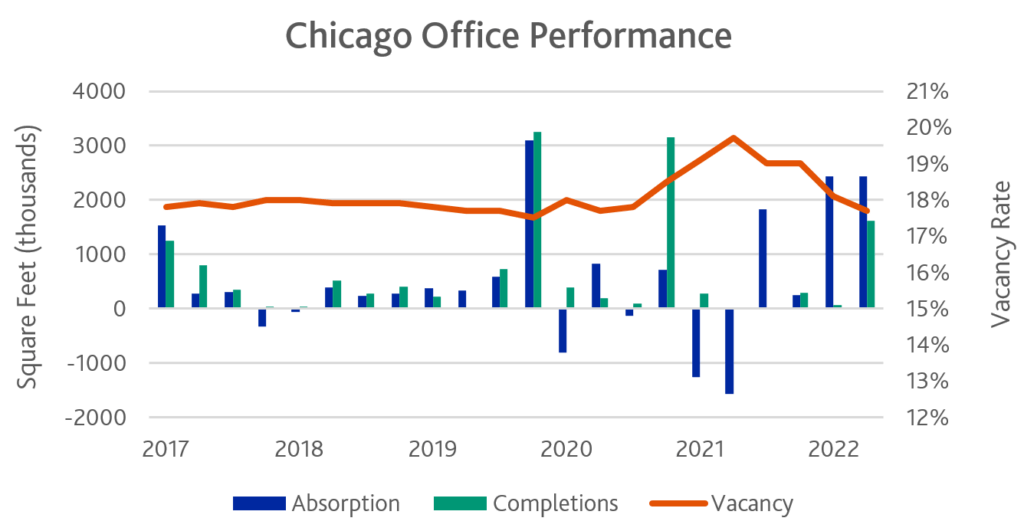
Q2 2021 thru Q2 2022
Inventory: +2,700,859 sq ft
Total Vacant: +1,808,274 sq ft
Direct Vacant: +2,177,696 sq ft
Sublet Vacant: -369,422 sq ft
Q3 2021
Net Inventory: +113658
Net Vacant: +1,749,800
Direct Vacant: +1,484,985
Sublet Vacant: +264,815
Q4 2021
Net Inventory: +388,356
Net Vacant: -571,715
Direct Vacant: +195,265
Sublet Vacant: -766,980
Q1 2022
Net Inventory: +2,151,055
Net Vacant: +130,485
Direct Vacant: +384,659
Sublet Vacant: -254,174
Q2 2022
Net Inventory: +47,790
Net Vacant: +499,804
Direct Vacant: +112,887
Sublet Vacant: +386,917


 Prev
Prev


 Linear Mode
