Quote:
Originally Posted by yuriandrade

Here you are:
---------------------- 2020 ------ 2010 ------ 2000 ------ 1990
Near North Side ------ 105,481 ----- 80,484 ---- 72,811 ---- 62,842 ----- 31.1% ----- 10.5% ----- 15.9% ------ 6.8 km²
Loop -------------------- 42,298 ----- 29,283 ---- 16,388 ---- 11,954 ----- 44.4% ----- 78.7% ----- 37.1% ------ 3.9 km²
Near South Side ------- 28,795 ----- 21,390 ----- 9,509 ----- 6,828 ----- 34.6% ---- 124.9% ----- 39.3% ------ 4.6 km²
Near West Side -------- 48,719 ----- 36,789 ---- 21,689 ---- 17,978 ----- 32.4% ----- 69.6% ----- 20.6% ------ 7.4 km²
Central Chicago ---- 225,293 --- 167,946 --- 120,397 ---- 99,602 ----- 34.1% ----- 39.5% ----- 20.9% ------ 22.8 km²
Chicago MSA ----- 9,618,502 - 9,461,105 - 9,098,314 - 8,182,076 ------ 1.7% ------ 4.0% ----- 11.2% -- 18,634 km²
For Near West Side, as it's way too big, I considered only the eastern half of it, using 10 censos tracts.
As it happens in Near North Side, it's the census tracts near Loop the ones booming, in both NSS an NWS. In fact, the southernmost census tract in NSS, majority Black, is actually collapsing. In 1990, it made up 40% of NSS population. Today, it represents mere 4%.
|
Not to nitpick but if you are going to count some Near West Side then you should count all of it. The population in 2020 of NWS was 67,881. The Central Area which is Near West/South/North + The Loop grew by 58,417 people or 31.4%. Total population of those 4 areas today is 244,455.
Quote:
|
Another thing: Chicago city proper minus Central Chicago declined by 7,000 people.
|
It is more nuanced than that and does not tell the complete story really. Besides the core (NNS, NWS, NSS, and The Loop) growing by a ton .
* The north lakefront (Lincoln Park, Lake View, North Center, Lincoln Square, Rogers Park, Edgewater, Uptown, West Ridge) grew by 25,718 people or a modest +5.48%.
* The south lakefront (Douglas, Oakland, Grand Boulevard, Washington Park, Hyde Park, Woodlawn, Kenwood, and South Shore) grew by 14,280 people or +8.06%.
Putting all of this together, the entire lakefront area from South Shore all the way north 20+ miles to the edge of the city in Rogers Park
counting the greater downtown area including all of Near West Side gained 98,415 people compared to 2010. This is a growth rate of 11.82%.
To put that into further perspective, that area had a population of 832,772 in 2010 and 931,187 in 2020. That was larger than San Francisco and Boston both in 2010 and still is, and that area had a higher population growth than both of those cities from 2010 to 2020. To put it into further perspective, the city of Dallas outgained that area in the same time period by "only" 8000 people and some change.
Now for some more insights:
* The area of the city along I-55 going down to Midway (Armour Square, Garfield Ridge, Archer Heights, McKinley Park, Bridgeport, Brighton Park, West Elsdon, West Lawn, and Clearing) gained 5705 people or a modest +2.49%. Areas like Bridgeport, McKinley Park, and Brighton Park got a bit more Asian than 2010, and Archer Heights went from very little Asian population to an increasingly sizable one. The areas closest to Midway Airport like West Elsdon, West Lawn, Clearing, etc got more Hispanic and less white.
* The area of the far NW side of the city plus some others in the NW side kind of adjacent - Edison Park, Norwood Park, Forest Glen, Dunning, Montclare, and Jefferson Park gained 5661 people or a modest +3.84%. These areas gained 10,724 Hispanic people while losing 10,988 white people.
however...
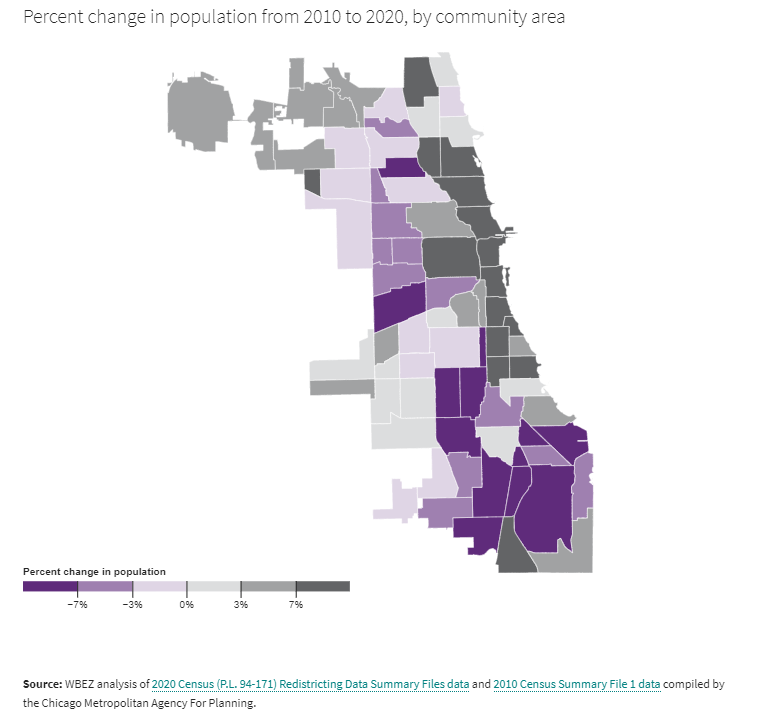
* The area nearby in Portage Park, Irving Park, Belmont Cragin, Albany Park, Hermosa, and Avondale lost 10,249 people - some of this area is definitely gentrifying. Other areas of the city which lost population from 2000 to 2010 had some of the same activity happening so it'll be interesting to see if any of these areas actually turn around and gain population by 2030.
Where the city got slammed in population loss was really part of the south side and also west side:
The area of Englewood, West Englewood, Auburn Gresham, Washington Heights, Greater Grand Crossing, Roseland, West Pullman, and Pullman lost 28,486 people. That almost offsets the gains of the north lakefront and part of the NW side. Part of this area went through some big demographic shifts with areas like West Englewood going from only about 2% Hispanic in 2010 to nearly 20% Hispanic in 2020.
Then the area on the west side of Austin, North and South Lawndale, East and West Garfield Park, and Humboldt Park lost another 16,005 people. Yet again, some of these areas became a bit more Hispanic. Austin for example went from under 9% Hispanic in 2020 to nearly 20% Hispanic in 2020. We don't have the 2020 ACS data yet, but I can tell you that the loss in Austin was actually a few thousand people better than expected. My guess is in part due to an influx in Hispanic population.
In fact, Austin recorded the largest Hispanic population gain of any community area in the city with +9868 Hispanic people.
1. Austin: +9868 Hispanic people
2. Chicago Lawn: +7808
3. Garfield Ridge: +5573
4. West Englewood: +5058
5. Dunning: +5043
6. New City: +4066
7. Ashburn: +4025
8. Clearing: +3984
9. West Lawn: +2709
10. Near North Side: +2612
The city is becoming even more Hispanic, and more Asian now. The Hispanic population in the city is now greater than the Black population, and thus will be interesting to see the political battle play out. It will also be interesting to see if there can be some Asian representation now that the SW side is increasingly Asian. Bridgeport is now over 42% Asian and McKinley Park is approaching 30% now. Nearby in downtown, Near South Side and the Loop are both over 20% Asian now. Near West Side is almost 19% Asian now. Brighton Park is now nearly 11% Asian and Archer Heights went from 1% Asian in 2010 to 4.3% in 2020.


 Prev
Prev


 That’s a really big downtown- land wise.


 Linear Mode
