...and now we move on to Canada! Toronto & Montreal have long been immigrant magnets per se but you can now see similar growth trends/patterns of diversity in immigrant countries/world regions of origin really start to take shape in many of Canada's other CMAs.


Image Source: siminca.com
Canada 2021
1 India 898,050
2 Philippines 719,575
3 China 715,830
4 United Kingdom 464,140
5 United States of America 256,090
6 Pakistan 234,105
7 Hong Kong 213,855
8 Italy 204,065
9 Iran 182,940
10 Viet Nam 182,090
[=================================================================]
11 Jamaica 145,355
12 Korea, South 138,350
13 Sri Lanka 136,240
14 Poland 135,030
15 Portugal 128,800
16 Germany 126,475
17 France 121,525
18 Haiti 99,940
19 Syria 97,590
20 Lebanon 95,725
[=================================================================]
21 Mexico 90,585
22 Romania 86,765
23 Guyana 85,530
24 Iraq 84,125
25 Russian Federation 81,840
26 Morocco 81,775
27 Nigeria 81,290
28 Ukraine 81,135
29 Colombia 80,570
30 Algeria 79,665
[=================================================================]
31 Netherlands 75,830
32 Egypt 73,705
33 Bangladesh 70,090
34 Taiwan 65,360
35 Trinidad and Tobago 65,040
36 Afghanistan 62,455
37 Greece 54,715
38 South Africa, Republic of 51,590
39 El Salvador 49,445
40 Brazil 48,450
[=================================================================]
41 Ethiopia 41,715
42 Croatia 36,680
43 Bosnia and Herzegovina 35,925
44 Turkey 35,270
45 Congo, Democratic Republic of the 33,115
46 Somalia 32,500
47 Serbia 31,925
48 Peru 31,415
49 Eritrea 31,390
50 Hungary 31,045
Total immigrant population (inc. 2,285 born in Canada) 8,361,505
Total Population 36,328,475
Source: Immigration and Ethnocultural Diversity, Statistics Canada (Statscan), Census 2021

Image Source: upload.wikimedia.org
Toronto, Canada 2021
1 India 394,620
2 China 296,625
3 Philippines 212,655
4 Pakistan 128,305
5 Hong Kong 99,515
6 Sri Lanka 99,280
7 Jamaica 95,900
8 Italy 87,875
9 Iran 87,105
10 United Kingdom 85,895
[=================================================================]
11 Guyana 64,885
12 Portugal 63,460
13 Viet Nam 62,105
14 Poland 50,410
15 Korea, South 48,775
16 United States of America 48,265
17 Trinidad and Tobago 40,855
18 Bangladesh 36,745
19 Iraq 34,580
20 Russian Federation 33,760
[=================================================================]
21 Ukraine 33,165
22 Afghanistan 27,420
23 Egypt 26,815
24 Nigeria 23,930
25 Greece 23,525
26 Romania 22,975
27 Syria 19,170
28 Germany 18,405
29 Colombia 17,360
30 Brazil 15,420
[=================================================================]
31 Taiwan 14,930
32 Mexico 14,445
33 United Arab Emirates 14,430
34 Turkey 14,405
35 Lebanon 14,355
36 Israel 13,980
37 Ghana 13,785
38 South Africa, Republic of 13,165
39 Saudi Arabia 12,705
40 Ethiopia 12,690
[=================================================================]
41 Somalia 12,400
42 Serbia 11,880
43 Ecuador 11,155
44 Albania 11,090
45 Croatia 10,895
46 Kenya 10,850
47 El Salvador 10,550
48 Hungary 9,820
49 Tanzania 9,665
50 Bosnia and Herzegovina 9,430
Total immigrant population 2,862,855
Census Metropolitan Area (CMA) Population: 6,142,885
Source: Immigration and Ethnocultural Diversity, Statistics Canada (Statscan), Census 2021

Image Source: letsgoplayoutside.com
Montréal, Canada 2021
1 Haiti 79,725
2 Algeria 66,735
3 France 63,235
4 Morocco 60,540
5 China 48,090
6 Italy 41,855
7 Lebanon 38,580
8 Philippines 28,970
9 Romania 24,625
10 Syria 24,545
[=================================================================]
11 India 24,075
12 Viet Nam 23,670
13 Egypt 19,260
14 Colombia 19,130
15 Iran 18,920
16 United States of America 18,340
17 Tunisia 16,035
18 Greece 15,615
19 Portugal 14,575
20 Cameroon 14,420
[=================================================================]
21 Mexico 14,245
22 Peru 12,460
23 Sri Lanka 10,740
24 Pakistan 10,640
25 Russian Federation 10,385
26 Congo, Democratic Republic of the 10,295
27 El Salvador 10,145
28 Moldova 9,835
29 United Kingdom 9,410
30 Côte d'Ivoire 8,750
[=================================================================]
31 Bangladesh 8,630
32 Ukraine 8,470
33 Cambodia 8,435
34 Poland 8,340
35 Afghanistan 7,840
36 Chile 7,355
37 Brazil 7,210
38 Turkey 6,915
39 Venezuela 6,735
40 Mauritius 6,315
[=================================================================]
41 Germany 5,910
42 Senegal 5,760
43 Bulgaria 5,750
44 Belgium 5,445
45 Dominican Republic 5,320
46 Cuba 5,300
47 Guatemala 5,155
48 Hong Kong 4,715
49 Israel 4,655
50 Korea, South 4,640
Total immigrant population 1,022,945
Census Metropolitan Area (CMA) Population: 4,206,455
Source: Immigration and Ethnocultural Diversity, Statistics Canada (Statscan), Census 2021

Image Source: img.locationscout.net
Vancouver, Canada 2021
1 China 204,825
2 India 151,405
3 Philippines 109,410
4 Hong Kong 76,120
5 United Kingdom 51,440
6 Iran 43,250
7 Korea, South 42,090
8 Taiwan 38,670
9 United States of America 27,615
10 Viet Nam 27,175
[=================================================================]
11 Fiji 15,980
12 Japan 11,565
13 Germany 11,545
14 Pakistan 11,125
15 Mexico 10,065
16 Russian Federation 9,345
17 Poland 9,210
18 Italy 9,095
19 South Africa, Republic of 9,000
20 Malaysia 7,975
[=================================================================]
21 Romania 7,230
22 Brazil 7,095
23 Ukraine 7,095
24 Iraq 6,555
25 Afghanistan 5,935
26 Australia 5,425
27 Netherlands 5,140
28 Ireland 5,030
29 Sri Lanka 4,870
30 Singapore 4,815
[=================================================================]
31 Syria 4,690
32 Indonesia 4,510
33 El Salvador 4,485
34 Portugal 4,405
35 France 4,365
36 Colombia 4,140
37 Kenya 4,010
38 Bosnia and Herzegovina 3,785
39 Serbia 3,745
40 Croatia 3,690
[=================================================================]
41 Czechia 3,085
42 Thailand 3,010
43 Peru 2,870
44 Tanzania 2,825
45 Hungary 2,745
46 Egypt 2,705
47 Uganda 2,580
48 Bangladesh 2,580
49 Greece 2,550
50 Turkey 2,540
Total immigrant population 1,089,185
Census Metropolitan Area (CMA) Population: 2,607,010
Source: Immigration and Ethnocultural Diversity, Statistics Canada (Statscan), Census 2021

Image Source: calgary.ca
Calgary, Canada 2021
1 Philippines 68,820
2 India 61,230
3 China 36,785
4 United Kingdom 24,455
5 Pakistan 19,380
6 Viet Nam 16,270
7 Nigeria 13,335
8 United States of America 12,405
9 Hong Kong 10,940
10 Korea, South 8,595
[=================================================================]
11 Ethiopia 7,160
12 Poland 6,330
13 Colombia 6,200
14 Iran 5,690
15 Germany 5,545
16 Mexico 5,405
17 Eritrea 4,780
18 Russian Federation 4,455
19 Lebanon 4,420
20 Syria 4,415
[=================================================================]
21 Romania 4,325
22 Afghanistan 4,280
23 Iraq 4,050
24 Venezuela 3,680
25 Bangladesh 3,620
26 South Africa, Republic of 3,585
27 Jamaica 3,535
28 Egypt 3,475
29 Italy 3,345
30 Ukraine 3,260
[=================================================================]
31 Netherlands 3,145
32 Kenya 3,020
33 Tanzania 2,940
34 El Salvador 2,725
35 Taiwan 2,200
36 Nepal 2,195
37 Bosnia and Herzegovina 2,185
38 Brazil 2,175
39 Sri Lanka 1,965
40 Chile 1,960
[=================================================================]
41 Malaysia 1,885
42 Ireland 1,845
43 Japan 1,780
44 Sudan 1,735
45 United Arab Emirates 1,725
46 Australia 1,715
47 Hungary 1,710
48 Somalia 1,580
49 Croatia 1,475
50 Ghana 1,455
Total immigrant population 460,880
Census Metropolitan Area (CMA) Population: 1,465,175
Source: Immigration and Ethnocultural Diversity, Statistics Canada (Statscan), Census 2021

Image Source: cdn-adventures-live.azureedge.net
Ottawa - Gatineau, Canada 2021
1 China 22,020
2 United Kingdom 17,450
3 India 16,975
4 Lebanon 14,485
5 Philippines 11,800
6 United States of America 10,500
7 Haiti 9,485
8 Syria 7,080
9 Iran 6,640
10 Viet Nam 6,565
[=================================================================]
11 Pakistan 5,825
12 Congo, Democratic Republic of the 5,800
13 France 5,165
14 Italy 5,005
15 Egypt 4,880
16 Iraq 4,750
17 Morocco 4,740
18 Somalia 4,710
19 Poland 4,485
20 Germany 4,250
[=================================================================]
21 Burundi 4,095
22 Russian Federation 3,750
23 Romania 3,675
24 Colombia 3,540
25 Portugal 3,480
26 Nigeria 3,440
27 Jamaica 3,435
28 Algeria 3,405
29 Bangladesh 3,355
30 Hong Kong 3,320
[=================================================================]
31 Cameroon 3,215
32 Afghanistan 3,110
33 Sri Lanka 3,035
34 Ukraine 3,005
35 Ethiopia 2,955
36 El Salvador 2,640
37 Kuwait 2,580
38 Bosnia and Herzegovina 2,530
39 Korea, South 2,470
40 Brazil 2,440
[=================================================================]
41 Mexico 2,370
42 Saudi Arabia 2,190
43 Côte d'Ivoire 2,125
44 Netherlands 2,105
45 United Arab Emirates 1,920
46 Turkey 1,880
47 Rwanda 1,790
48 Tunisia 1,700
49 Jordan 1,675
50 Djibouti 1,635
Total immigrant population 313,845
Census Metropolitan Area (CMA) Population: 1,464,500
Source: Immigration and Ethnocultural Diversity, Statistics Canada (Statscan), Census 2021

Image Source: media.radissonhotelsamericas.com
Edmonton, Canada 2021
1 Philippines 62,565
2 India 53,685
3 China 21,725
4 United Kingdom 16,605
5 Viet Nam 10,515
6 Pakistan 9,285
7 United States of America 8,580
8 Poland 7,500
9 Hong Kong 7,245
10 Nigeria 6,050
[=================================================================]
11 Germany 6,010
12 Korea, South 5,870
13 Somalia 5,830
14 Ethiopia 5,665
15 Lebanon 4,800
16 Syria 4,480
17 Eritrea 4,095
18 Ukraine 4,080
19 Jamaica 3,915
20 Netherlands 3,365
[=================================================================]
21 Mexico 3,315
22 Italy 3,175
23 Colombia 2,990
24 Fiji 2,915
25 Egypt 2,805
26 Iran 2,765
27 El Salvador 2,665
28 South Africa, Republic of 2,595
29 Sri Lanka 2,450
30 Kenya 2,375
[=================================================================]
31 Portugal 2,320
32 Russian Federation 2,285
33 Romania 2,145
34 Bangladesh 2,125
35 Congo, Democratic Republic of the 1,965
36 Malaysia 1,960
37 Afghanistan 1,930
38 Iraq 1,920
39 Nepal 1,905
40 Chile 1,885
[=================================================================]
41 Sudan 1,775
42 Ghana 1,755
43 Zimbabwe 1,670
44 Bosnia and Herzegovina 1,645
45 Trinidad and Tobago 1,635
46 Ireland 1,635
47 Turkey 1,610
48 Brunei Darussalam 1,600
49 Croatia 1,565
50 Uganda 1,565
Total immigrant population 363,910
Census Metropolitan Area (CMA) Population: 1,397,750
Source: Immigration and Ethnocultural Diversity, Statistics Canada (Statscan), Census 2021

Image Source: worldatlas.com
Winnipeg, Canada 2021
1 Philippines 62,480
2 India 28,245
3 China 8,980
4 Nigeria 7,545
5 United Kingdom 7,185
6 Viet Nam 4,400
7 United States of America 4,345
8 Ukraine 4,295
9 Poland 3,955
10 Pakistan 3,770
[=================================================================]
11 Germany 3,750
12 Portugal 3,750
13 Korea, South 2,680
14 Eritrea 2,615
15 Ethiopia 2,460
16 Italy 2,345
17 Russian Federation 2,135
18 Jamaica 1,845
19 Syria 1,695
20 Brazil 1,600
[=================================================================]
21 Trinidad and Tobago 1,575
22 El Salvador 1,485
23 Israel 1,420
24 Congo, Democratic Republic of the 1,335
25 Iraq 1,245
26 Bangladesh 1,245
27 Paraguay 1,220
28 Egypt 1,205
29 Hong Kong 1,180
30 Netherlands 1,150
[=================================================================]
31 Guyana 1,145
32 Sri Lanka 1,065
33 Iran 1,055
34 Mexico 1,025
35 Sudan 905
36 Bosnia and Herzegovina 865
37 Laos 840
38 Afghanistan 835
39 Colombia 795
40 Somalia 785
[=================================================================]
41 Kenya 780
42 Argentina 760
43 Chile 755
44 France 735
45 Greece 720
46 South Africa, Republic of 715
47 Croatia 695
48 Kazakhstan 580
49 Thailand 555
50 Hungary 540
Total immigrant population 207,950
Census Metropolitan Area (CMA) Population: 819,715
Source: Immigration and Ethnocultural Diversity, Statistics Canada (Statscan), Census 2021

Image Source: ville.quebec.qc.ca
Québec, Canada 2021
1 France 10,240
2 Colombia 3,305
3 Morocco 3,115
4 Côte d'Ivoire 2,765
5 Cameroon 2,510
6 Algeria 2,265
7 Tunisia 2,175
8 Haiti 1,420
9 Congo, Democratic Republic of the 1,415
10 Brazil 1,285
[=================================================================]
11 China 1,155
12 United States of America 1,065
13 Mexico 985
14 Senegal 930
15 Bosnia and Herzegovina 920
16 Burundi 785
17 Belgium 775
18 Viet Nam 725
19 Romania 720
20 Rwanda 545
[=================================================================]
21 Syria 535
22 Germany 480
23 Togo 435
24 Cuba 425
25 Madagascar 410
26 Italy 395
27 El Salvador 390
28 Ukraine 380
29 Benin 370
30 Burkina Faso 350
[=================================================================]
31 United Kingdom 340
32 Peru 330
33 Guinea 330
34 Iran 330
35 Chile 325
36 Russian Federation 325
37 Portugal 325
38 Tanzania 325
39 Moldova 300
40 Congo, Republic of the 300
[=================================================================]
41 Lebanon 295
42 Cambodia 285
43 Philippines 280
44 Switzerland 275
45 Venezuela 270
46 Poland 270
47 Central African Republic 265
48 Mali 250
49 Thailand 250
50 Bulgaria 245
Total immigrant population 54,855
Census Metropolitan Area (CMA) Population: 817,105
Source: Immigration and Ethnocultural Diversity, Statistics Canada (Statscan), Census 2021

Image Source: ljmtower.ca
Hamilton, Canada 2021
1 United Kingdom 21,255
2 India 15,815
3 Philippines 10,570
4 Italy 10,135
5 Poland 7,545
6 Pakistan 6,725
7 Iraq 6,635
8 Portugal 6,500
9 China 6,215
10 United States of America 5,895
[=================================================================]
11 Croatia 4,895
12 Jamaica 4,160
13 Syria 3,935
14 Germany 3,855
15 Viet Nam 3,830
16 Netherlands 3,230
17 Bosnia and Herzegovina 3,105
18 Colombia 2,820
19 Romania 2,520
20 Serbia 2,445
[=================================================================]
21 Egypt 2,285
22 Iran 2,170
23 Korea, South 2,170
24 Nigeria 2,060
25 El Salvador 1,920
26 Trinidad and Tobago 1,910
27 Guyana 1,775
28 Afghanistan 1,635
29 South Africa, Republic of 1,590
30 Lebanon 1,590
[=================================================================]
31 Hungary 1,500
32 Greece 1,420
33 Bangladesh 1,350
34 Ukraine 1,285
35 Mexico 1,235
36 Russian Federation 1,230
37 Sri Lanka 1,230
38 Hong Kong 1,095
39 Saudi Arabia 1,090
40 Turkey 1,025
[=================================================================]
41 Jordan 1,020
42 Somalia 990
43 Czechia 955
44 Kosovo 955
45 Ireland 950
46 Kenya 885
47 Brazil 865
48 Venezuela 805
49 United Arab Emirates 805
50 Congo, Democratic Republic of the 750
Total immigrant population 197,845
Census Metropolitan Area (CMA) Population: 773,440
Source: Immigration and Ethnocultural Diversity, Statistics Canada (Statscan), Census 2021

Image Source: londontourism.ca
London, Canada 2021
1 United Kingdom 10,670
2 India 8,985
3 China 5,170
4 Syria 4,835
5 Poland 4,395
6 United States of America 4,390
7 Portugal 4,295
8 Colombia 3,900
9 Iraq 3,685
10 Philippines 3,605
[=================================================================]
11 Netherlands 3,010
12 Pakistan 2,775
13 Korea, South 2,360
14 Italy 2,310
15 Lebanon 2,295
16 Germany 2,170
17 Viet Nam 1,880
18 Jamaica 1,835
19 El Salvador 1,700
20 Saudi Arabia 1,500
[=================================================================]
21 Iran 1,470
22 Nigeria 1,360
23 Egypt 1,210
24 Bosnia and Herzegovina 1,080
25 Afghanistan 1,040
26 Romania 1,020
27 Greece 1,015
28 Jordan 995
29 Mexico 965
30 United Arab Emirates 945
[=================================================================]
31 Ukraine 890
32 Trinidad and Tobago 880
33 Hungary 840
34 Cambodia 800
35 Croatia 785
36 Kosovo 780
37 Sudan 780
38 Hong Kong 760
39 Brazil 705
40 Ireland 675
[=================================================================]
41 South Africa, Republic of 645
42 West Bank and Gaza Strip 620
43 Nepal 620
44 Russian Federation 570
45 Guyana 550
46 Turkey 550
47 Bangladesh 520
48 Bhutan 520
49 Thailand 515
50 Guatemala 490
Total immigrant population 115,605
Census Metropolitan Area (CMA) Population: 535,780
Source: Immigration and Ethnocultural Diversity, Statistics Canada (Statscan), Census 2021

Image Source: chfcanada.coopchfcanada.coop
Halifax, Canada 2021
1 United Kingdom 6,595
2 India 4,800
3 China 3,740
4 United States of America 3,680
5 Philippines 3,505
6 Syria 2,085
7 Nigeria 1,630
8 Lebanon 1,350
9 Korea, South 1,015
10 Iran 985
[=================================================================]
11 Germany 935
12 Egypt 900
13 Pakistan 785
14 Russian Federation 635
15 Viet Nam 615
16 Jamaica 570
17 Poland 570
18 Ukraine 540
19 Kuwait 525
20 Bangladesh 505
[=================================================================]
21 Netherlands 480
22 Saudi Arabia 465
23 Israel 450
24 South Africa, Republic of 435
25 Iraq 410
26 Italy 390
27 Brazil 370
28 Jordan 365
29 Sri Lanka 355
30 Ireland 345
[=================================================================]
31 Kenya 335
32 United Arab Emirates 310
33 Turkey 300
34 Hong Kong 295
35 Greece 275
36 France 265
37 Romania 260
38 Mexico 255
39 Congo, Democratic Republic of the 255
40 Australia 255
[=================================================================]
41 Ethiopia 245
42 Japan 245
43 Bosnia and Herzegovina 240
44 Sudan 230
45 Trinidad and Tobago 215
46 Kosovo 205
47 Colombia 195
48 Libya 195
49 Guyana 180
50 Croatia 175
Total immigrant population 51,485
Census Metropolitan Area (CMA) Population: 461,140
Source: Immigration and Ethnocultural Diversity, Statistics Canada (Statscan), Census 2021

Image Source: cbre.ca
Windsor, Canada 2021
1 Iraq 9,325
2 United States of America 6,730
3 India 6,330
4 Italy 5,595
5 Lebanon 4,910
6 United Kingdom 4,805
7 China 4,110
8 Syria 3,960
9 Mexico 3,710
10 Philippines 3,155
[=================================================================]
11 Pakistan 2,710
12 Poland 2,515
13 Romania 2,260
14 Viet Nam 1,920
15 Croatia 1,640
16 Portugal 1,620
17 Serbia 1,490
18 Bosnia and Herzegovina 1,390
19 Germany 1,140
20 Jamaica 1,025
[=================================================================]
21 El Salvador 920
22 Greece 840
23 Nigeria 840
24 North Macedonia 815
25 Saudi Arabia 730
26 Iran 700
27 Somalia 675
28 Bangladesh 645
29 Netherlands 640
30 Albania 630
[=================================================================]
31 Jordan 615
32 Hong Kong 595
33 Hungary 590
34 Bhutan 535
35 Egypt 525
36 United Arab Emirates 505
37 Turkey 475
38 Kuwait 430
39 Korea, South 425
40 Thailand 420
[=================================================================]
41 West Bank and Gaza Strip 410
42 Nepal 405
43 Colombia 390
44 Bolivia 350
45 Libya 335
46 Congo, Democratic Republic of the 335
47 Trinidad and Tobago 310
48 Ethiopia 310
49 Cambodia 310
50 France 305
Total immigrant population 96,905
Census Metropolitan Area (CMA) Population: 415,505
Source: Immigration and Ethnocultural Diversity, Statistics Canada (Statscan), Census 2021

Image Source: tourismvictoria.com
Victoria, Canada 2021
1 United Kingdom 15,185
2 United States of America 6,505
3 China 6,480
4 Philippines 6,140
5 India 4,880
6 Germany 2,610
7 Netherlands 1,505
8 Korea, South 1,340
9 South Africa, Republic of 1,250
10 Hong Kong 1,195
[=================================================================]
11 Japan 1,190
12 Viet Nam 1,140
13 Poland 945
14 Iran 900
15 Portugal 875
16 Mexico 870
17 Australia 740
18 Russian Federation 735
19 Taiwan 660
20 Italy 645
[=================================================================]
21 France 580
22 Ireland 550
23 Syria 540
24 Colombia 535
25 Ukraine 535
26 New Zealand 530
27 Pakistan 475
28 Romania 445
29 Brazil 415
30 Hungary 400
[=================================================================]
31 Denmark 380
32 Thailand 355
33 Jamaica 335
34 Croatia 335
35 Malaysia 325
36 Czechia 310
37 Ethiopia 305
38 Turkey 290
39 Nigeria 285
40 Greece 270
[=================================================================]
41 Trinidad and Tobago 250
42 Switzerland 250
43 Chile 235
44 Israel 230
45 El Salvador 225
46 Sweden 220
47 Kenya 220
48 Serbia 210
49 Austria 205
50 Norway 200
Total immigrant population 73,345
Census Metropolitan Area (CMA) Population: 388,475
Source: Immigration and Ethnocultural Diversity, Statistics Canada (Statscan), Census 2021
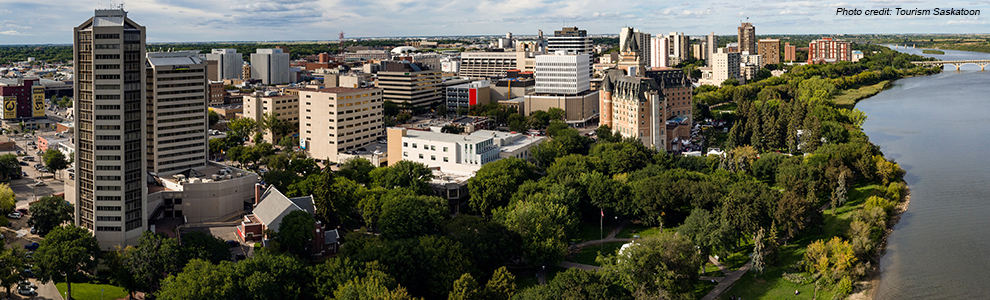
Image Source: saskatoon.ca
Saskatoon, Canada 2021
1 Philippines 12,185
2 India 6,050
3 China 4,805
4 Pakistan 4,005
5 United Kingdom 2,520
6 Nigeria 2,115
7 Bangladesh 1,850
8 United States of America 1,740
9 Viet Nam 1,520
10 Iraq 1,225
[=================================================================]
11 Ukraine 1,180
12 Germany 680
13 Iran 675
14 Syria 655
15 South Africa, Republic of 530
16 Poland 510
17 Eritrea 490
18 Mexico 470
19 Jamaica 460
20 Hong Kong 450
[=================================================================]
21 Egypt 375
22 Sudan 365
23 Romania 355
24 El Salvador 345
25 Ethiopia 340
26 Colombia 335
27 Korea, South 300
28 Sri Lanka 300
29 Myanmar 290
30 Russian Federation 280
[=================================================================]
31 Nepal 275
32 Chile 270
33 Netherlands 270
34 Bosnia and Herzegovina 265
35 Ireland 255
36 Brazil 215
37 South Sudan 215
38 United Arab Emirates 210
39 Italy 205
40 Afghanistan 200
[=================================================================]
41 Moldova 195
42 Serbia 190
43 Thailand 185
44 Congo, Democratic Republic of the 180
45 Saudi Arabia 180
46 Kenya 175
47 Mauritius 175
48 Australia 170
49 Turkey 160
50 Greece 155
Total immigrant population 56,070
Census Metropolitan Area (CMA) Population: 311,520
Source: Immigration and Ethnocultural Diversity, Statistics Canada (Statscan), Census 2021

Image Source: economicdevelopmentregina.com
Regina, Canada 2021
1 Philippines 9,905
2 India 7,495
3 China 2,920
4 Pakistan 2,655
5 Nigeria 2,260
6 United Kingdom 1,545
7 Viet Nam 1,415
8 United States of America 1,265
9 Bangladesh 1,255
10 Ukraine 900
[=================================================================]
11 Jamaica 680
12 Syria 640
13 Germany 495
14 Eritrea 425
15 Korea, South 395
16 Myanmar 350
17 Somalia 345
18 Egypt 345
19 South Africa, Republic of 340
20 Mexico 335
[=================================================================]
21 Ethiopia 320
22 Sudan 320
23 Italy 290
24 Kenya 285
25 Greece 270
26 Thailand 270
27 Afghanistan 260
28 Ghana 255
29 Hong Kong 255
30 Iran 250
[=================================================================]
31 Poland 235
32 Congo, Democratic Republic of the 230
33 Netherlands 220
34 Croatia 220
35 Bosnia and Herzegovina 210
36 Saudi Arabia 205
37 Russian Federation 200
38 Romania 190
39 Iraq 190
40 Chile 185
[=================================================================]
41 Nepal 185
42 Ireland 180
43 Laos 170
44 El Salvador 165
45 South Sudan 165
46 Hungary 135
47 Uganda 135
48 Albania 130
49 France 125
50 Israel 125
Total immigrant population 46,050
Census Metropolitan Area (CMA) Population: 244,950
Source: Immigration and Ethnocultural Diversity, Statistics Canada (Statscan), Census 2021
There's more to come, so stay tuned -- we've got New Zealand and the Netherlands among others to explore.


 Prev
Prev


:max_bytes(150000):strip_icc()/GettyImages-163113170-5c4f1e6346e0fb00014c3781.jpg)


 Linear Mode
