HomeDiagramsDatabaseMapsForum About
     

Go Back   SkyscraperPage Forum > Regional Sections > Canada


Reply

 
Thread Tools Display Modes
     
     
  #1  
Old Posted Jan 28, 2021, 12:40 AM
Kilgore Trout's Avatar
Kilgore Trout Kilgore Trout is offline
菠蘿油
 
Join Date: Jul 2001
Location: hong kong / montreal
Posts: 6,137
Where Canada's cultural/ethnic communities are concentrated

To waste a bit of time I looked at the 2016 census data to find out where various ethnic and cultural groups are concentrated in Canada.

Here's a handful of random ones to start with.

Chinese

By population

1. Toronto – 700,710
2. Vancouver – 499,175
3. Montreal – 108,780

By percentage of total CMA population

1. Vancouver – 20.6%
2. Toronto – 12%
3. Calgary – 7.6%


Punjabi

By population

1. Toronto – 47,760
2. Vancouver – 30,670
3. Calgary – 8,570

By percentage of total CMA population

1. Abbotsford – 3%
2. Vancouver – 1.3%
3. Toronto – 0.8%


Vietnamese

By population

1. Toronto – 73,740
2. Montreal – 38,655
3. Vancouver – 34,915

By percentage of total CMA population

1. Calgary – 1.5%
2. Vancouver – 1.4%
3. Toronto – 1.3%


North African

By population

1. Montreal – 201,520
2. Toronto – 53,740
3. Ottawa-Gatineau – 18,515

By percentage of total CMA population

1. Montreal – 5%
2. Ottawa – 1.4%
3. Quebec City – 1.1%


Latin American

By population

1. Toronto – 155,990
2. Montreal – 135,410
3. Vancouver – 49,105

By percentage of total CMA population

1. Montreal – 3.4%
2. Toronto – 2.6%
3. Calgary – 2.5%


Italian

By population

1. Toronto – 484,365
2. Montreal – 279,796
3. Vancouver – 87,875

By percentage of total CMA population

1. Sault Ste. Marie – 20.9%
2. Ste. Catharines-Niagara – 12.4%
3. Hamilton – 10.8%


Armenian

By population

1. Montreal – 26,100
2. Toronto – 21,710
3. Vancouver – 2,845

By percentage of total CMA population

1. Montreal – 0.7%
2. Toronto – 0.4%
3. Hamilton – 0.2%
3. St. Catharines-Niagara – 0.2%
3. Windsor – 0.2%
3. Kitchener – 0.2%


Filipino

By population

1. Toronto – 274,675
2. Vancouver – 133,925
3. Winnipeg – 77,305

By percentage of total CMA population

1. Winnipeg – 10.2%
2. Vancouver – 5.5%
2. Calgary – 5.5%
3. Edmonton – 5%


Haitian

By population

1. Montreal – 132,255
2. Ottawa-Gatineau – 13,785
3. Quebec City – 2,235

By percentage of total CMA population

1. Montreal – 3.3%
2. Ottawa – 1.1%
3. Quebec City – 0.3%
3. Sherbrooke – 0.3%


Jamaican

By population

1. Toronto – 200,330
2. Montreal – 12,750
3. Oshawa – 11,855

By percentage of total CMA population

1. Toronto – 3.4%
2. Oshawa – 3.2%
3. Barrie – 1.4%


First Nations

By population

1. Montreal – 101,915
2. Toronto – 56,655
3. Edmonton – 54,690

By percentage of total CMA population

1. Thunder Bay – 10.5%
2. Sault Ste. Marie – 9.4%
3. Sudbury – 7.2%
__________________
¯\_(ツ)_/¯

Last edited by Kilgore Trout; Jan 28, 2021 at 1:06 AM.
Reply With Quote
     
     
  #2  
Old Posted Jan 28, 2021, 12:51 AM
Antigonish Antigonish is online now
Registered User
 
Join Date: Sep 2010
Location: Home sweet home
Posts: 763
Quote:
First Nations

By population

1. Montreal – 101,915
Whoa I had no idea that was the case
Reply With Quote
     
     
  #3  
Old Posted Jan 28, 2021, 1:02 AM
JHikka's Avatar
JHikka JHikka is offline
ハルウララ
 
Join Date: Jul 2009
Location: Toronto
Posts: 12,853
StatCan's qualifiers and categories for ethnic communities needs a serious do-over. Some of the categories and answers overlap over and over again.
Reply With Quote
     
     
  #4  
Old Posted Jan 28, 2021, 1:11 AM
Kilgore Trout's Avatar
Kilgore Trout Kilgore Trout is offline
菠蘿油
 
Join Date: Jul 2001
Location: hong kong / montreal
Posts: 6,137
Quote:
Originally Posted by JHikka View Post
StatCan's qualifiers and categories for ethnic communities needs a serious do-over. Some of the categories and answers overlap over and over again.
In what sense?
__________________
¯\_(ツ)_/¯
Reply With Quote
     
     
  #5  
Old Posted Jan 28, 2021, 1:27 AM
JHikka's Avatar
JHikka JHikka is offline
ハルウララ
 
Join Date: Jul 2009
Location: Toronto
Posts: 12,853
Quote:
Originally Posted by Kilgore Trout View Post
In what sense?
As you pointed out prior to editing, you can select 'South Asian' as a category, so categorizing peoples within that group can be a bit of a headache (why the number for Punjab is a bit finicky). StatCan still uses terms like 'Black' or 'Arab' for qualifying vast groups of people, despite backgrounds in each of these categories differing.


Below is the evolution of questions asked on census':


https://www150.statcan.gc.ca/n1/pub/...019002-eng.htm

For me, I think language stats and breakdowns would give a better idea of cultural and ethnic areas. Language spoken most often at home, knowledge of non-official languages, and mother tongue would all be good indicators of ethnic enclaves and cultures existing in specific areas. For some, like Jamaican as one example, they obviously wouldn't show up as they already speak an official language prior to entering Canada.

I don't mean to be a downer on your thread because there is some validity to the self-reporting visible minority process - my issue is more with StatCan's categorization.
Reply With Quote
     
     
  #6  
Old Posted Jan 28, 2021, 3:23 AM
ssiguy ssiguy is offline
Registered User
 
Join Date: Mar 2006
Location: White Rock BC
Posts: 10,741
To me, the big issue is where one particular ethnicity/race completely dominates all others. You can see this in spades in Vancouver city with the massive Chinese population. There are also many Filipinos in Vancouver but the Chinese completely dominate the social, economic, cultural, and political spheres and Filipinos are basically non-existent in any of those categories. The city of Vancouver is not multicultural but rather bi-cultural.

I think it is vastly more healthy for the cities and immigrants themselves where you have 8 groups with 5% of the population as opposed to 2 with 20% each.
Reply With Quote
     
     
  #7  
Old Posted Jan 28, 2021, 3:27 AM
someone123's Avatar
someone123 someone123 is offline
hähnchenbrüstfiletstüc
 
Join Date: Nov 2001
Location: Vancouver
Posts: 33,694
Quote:
Originally Posted by ssiguy View Post
To me, the big issue is where one particular ethnicity/race completely dominates all others. You can see this in spades in Vancouver city with the massive Chinese population. There are also many Filipinos in Vancouver but the Chinese completely dominate the social, economic, cultural, and political spheres and Filipinos are basically non-existent in any of those categories. The city of Vancouver is not multicultural but rather bi-cultural.
If you put "Chinese" on the census form does it even mean that you are "culturally" Chinese, like a person from China, or speak Chinese? Some people have Chinese ancestry but are completely North Americanized. It's hard to know what to make of these numbers. As JHikka says many categories also overlap.

Vancouver is in the top 3 in absolute numbers in 7 of these categories.

I question if group A having X% while group B is Y% < X% means that A is "dominating" B. People complain about foreign buyers and conspicuous consumption in Vancouver and associate that with Chinese. It might be true that Chinese make up the biggest group of these rich conspicuous consumers. But that group is nowhere near 20% here and they are not getting invited to Meng Wanzhou's famous house arrest lockdown mansion parties. I suspect most people who would tick the Chinese option on the census are near the median for income, work average jobs, own average amounts of property, and have no particular ability to dominate anybody.
Reply With Quote
     
     
  #8  
Old Posted Jan 28, 2021, 4:17 AM
Kilgore Trout's Avatar
Kilgore Trout Kilgore Trout is offline
菠蘿油
 
Join Date: Jul 2001
Location: hong kong / montreal
Posts: 6,137
Quote:
Originally Posted by JHikka View Post
As you pointed out prior to editing, you can select 'South Asian' as a category, so categorizing peoples within that group can be a bit of a headache (why the number for Punjab is a bit finicky). StatCan still uses terms like 'Black' or 'Arab' for qualifying vast groups of people, despite backgrounds in each of these categories differing.
Ah yes, that’s true, although the figures I used are from the ethnicity section rather than the visible minority section. I’m not sure how reliable those visible minority figures are because not only are the categories weird (they break down Chinese, Korean and Japanese but have just one broad category for Black) the numbers don’t add up with the corresponding ethnicity figures.

It’s also worth noting that people can choose multiple ethnicities (of course).
__________________
¯\_(ツ)_/¯
Reply With Quote
     
     
  #9  
Old Posted Jan 28, 2021, 4:21 AM
someone123's Avatar
someone123 someone123 is offline
hähnchenbrüstfiletstüc
 
Join Date: Nov 2001
Location: Vancouver
Posts: 33,694
The 2016 data is interesting but I think it's pretty outdated now for a lot of cities. Places like Toronto have had many significant immigrant populations going back decades but there are a bunch of Canadian cities that have been getting a lot of immigration only for the past 5 years or so, roughly coinciding with the JT government and in some cases ramping up a bit earlier. It would be interesting to see what the recent flows are like and if different types of immigrants head to different destinations. The 2021 census will I guess reveal some of that when compared against 2016.
Reply With Quote
     
     
  #10  
Old Posted Jan 28, 2021, 5:21 AM
JHikka's Avatar
JHikka JHikka is offline
ハルウララ
 
Join Date: Jul 2009
Location: Toronto
Posts: 12,853
Quote:
Originally Posted by someone123 View Post
The 2016 data is interesting but I think it's pretty outdated now for a lot of cities. Places like Toronto have had many significant immigrant populations going back decades but there are a bunch of Canadian cities that have been getting a lot of immigration only for the past 5 years or so, roughly coinciding with the JT government and in some cases ramping up a bit earlier. It would be interesting to see what the recent flows are like and if different types of immigrants head to different destinations. The 2021 census will I guess reveal some of that when compared against 2016.
I'd have to go back and check but i'm pretty sure Arabic was the mostly widely spoken language in New Brunswick after English and French in the 2016 Census, IIRC. Will definitely be interesting to see what changes have occurred over another four-ish years of immigration boost from the Trudeau government as you rightly point out.

Edit -

Yes, Mother Tongue 2016 in NB:
English 472,725
French 231,100

Arabic 2,855
Mandarin 2,250
Mi'kmaq 1,835
German 1,650
Korean 1,550
Tagalog 1,120

Will be interesting to see how this shifts and changes for 2021.
Reply With Quote
     
     
  #11  
Old Posted Jan 28, 2021, 7:18 AM
zahav zahav is offline
Registered User
 
Join Date: Apr 2009
Location: Vancouver
Posts: 1,884
Ya some of those designators are off. Abbotsford is over 20% South Asian (the majority of whom are Punjabi) so 3% is not correct. And I don't think Montreal has the largest indigenous population in Canada. The numbers I get on StatsCan are very different, it shows only 34,000 claim part or whole Aboriginal identity in Montreal CMA, vs. 61,000 in Vancouver CMA, 43,000 in Toronto CMA, and 76,205 in Edmonton CMA
Reply With Quote
     
     
  #12  
Old Posted Jan 28, 2021, 8:05 AM
SignalHillHiker's Avatar
SignalHillHiker SignalHillHiker is online now
I ♣ Baby Seals
 
Join Date: Jul 2012
Location: Sin Jaaawnz, Newf'nland
Posts: 34,735
The ethnicity options are a little confusing.

The most popular one here, for example, is “Canadian” at around 50% the population of St. John’s. Lots of overlap with English/Irish/French. Almost no one (2.3K) wrote in Newfoundlander. We need an awareness campaign here to remind people that’s now an option.

In terms of minorities, our data is outdated because we only recently put an emphasis on immigration, which increased 40% from 2017-19. Most come from the United Kingdom (nearly double the second highest) and United States.

Linguistically, after English and 16K French, the most common languages (each a little over 1K) are Arabic, Mandarin and Spanish.

Among visible minorities, most define themselves as:


Really curious to see that stat in the next census. Black and Filipino immigration is visibly increased. There are times driving down Merrymeeting Road where I come out of the fog of the commute only because I’ve noticed none of the dozens of people I’ve driven past are white. Used to be impossible here except along Elizabeth Avenue (rentals on one side, university on the orher). I think we’re going to be much more diverse in the next one.
__________________
Note to self: "The plural of anecdote is not evidence."
Reply With Quote
     
     
  #13  
Old Posted Jan 28, 2021, 3:50 PM
esquire's Avatar
esquire esquire is offline
Registered User
 
Join Date: Oct 2001
Posts: 37,483
With regard to the Statscan categories, are they just trudging along with the somewhat awkward and ill fitting descriptors for the sake of allowing consistent year over year comparisons? If you wipe the slate clean and start over again, then how do you compare trends under the old categories vs. the new ones?

Seems to me that there is no ideal solution here... either carry on with the existing categories with their shortcomings so that you can have consistency, or shake things up but then good luck looking at long term trends.
Reply With Quote
     
     
  #14  
Old Posted Jan 28, 2021, 5:55 PM
CivicBlues CivicBlues is offline
Registered User
 
Join Date: Oct 2014
Posts: 947
Quote:
Originally Posted by ssiguy View Post
To me, the big issue is where one particular ethnicity/race completely dominates all others. You can see this in spades in Vancouver city with the massive Chinese population. There are also many Filipinos in Vancouver but the Chinese completely dominate the social, economic, cultural, and political spheres and Filipinos are basically non-existent in any of those categories. The city of Vancouver is not multicultural but rather bi-cultural.

I think it is vastly more healthy for the cities and immigrants themselves where you have 8 groups with 5% of the population as opposed to 2 with 20% each.
You mean how White Euro culture completely dominates in other 80% of Canada's towns and cities? Do you hold as much distain for that as you do Vancouver which you claim to be an expert in it's multicultural mosaic, despite the fact you've moved to lily-white "White Rock"?
Reply With Quote
     
     
  #15  
Old Posted Jan 28, 2021, 7:03 PM
MolsonExport's Avatar
MolsonExport MolsonExport is offline
The Vomit Bag.
 
Join Date: Oct 2003
Location: Otisburgh
Posts: 44,923
First Nations proportion. I would have guessed Winnipeg or Regina on top. Way ahead of Montreal. I am surprised.
__________________
The whole problem with the world is that fools and fanatics are always so certain of themselves, and wiser people so full of doubts. (Bertrand Russell)
Reply With Quote
     
     
  #16  
Old Posted Jan 28, 2021, 7:05 PM
MolsonExport's Avatar
MolsonExport MolsonExport is offline
The Vomit Bag.
 
Join Date: Oct 2003
Location: Otisburgh
Posts: 44,923
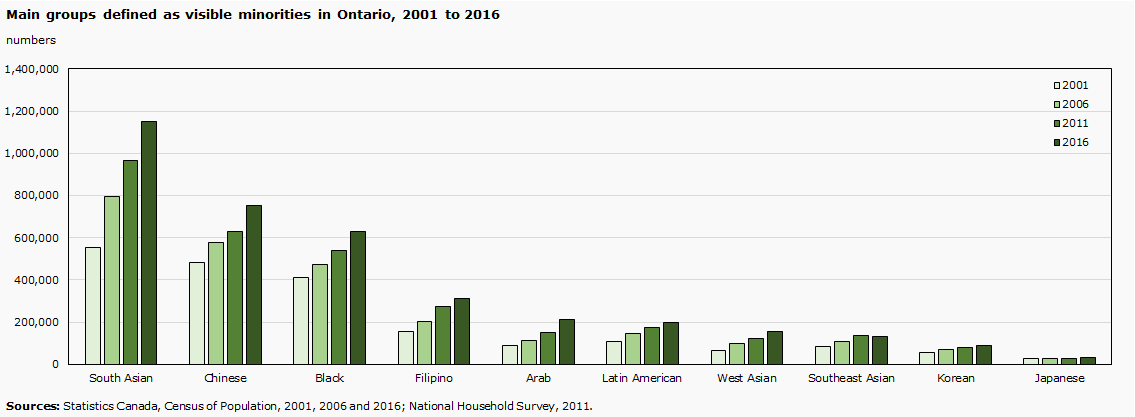
Jewish Canadians by city
2001 2011 Trend
City Population Jews Percentage Population Jews Percentage
Greater Toronto Area 5,081,826 179,100 3.5% 6,054,191 188,710 3.1% Increase 5.4%
Greater Montreal 3,380,645 92,975 2.8% 3,824,221 90,780 2.4% Decrease 2.4%
Greater Vancouver 1,967,480 22,590 1.1% 2,313,328 26,255 1.1% Increase 16.2%
Calgary 943,315 7,950 0.8% 1,096,833 8,335 0.8% Increase 4.8%
Ottawa 795,250 13,130 1.7% 883,390 14,010 1.6% Increase 6.7%
Edmonton 666,105 4,920 0.7% 812,201 5,550 0.7% Increase 12.8%
Winnipeg 619,540 14,760 2.4% 663,617 13,690 2.0% Decrease 7.2%
Hamilton 490,270 4,675 1.0% 519,949 5,110 1.0% Increase 9.3%
Kitchener-Waterloo 495,845 1,950 0.4% 507,096 2,015 0.4% Increase 3.3%
Halifax 355,945 1,985 0.6% 390,096 2,120 0.5% Increase 6.8%
London 336,539 2,290 0.7% 366,151 2,675 0.7% Increase 16.8%
Victoria 74,125 2,595 3.5% 80,017 2,740 3.4% Increase 5.6%
Windsor 208,402 1,525 0.7% 210,891 1,515 0.7% Decrease 0.7%

Montreal's seems lower than I expected. After years of losing Jews to English Canada, I thought that the population loss had been stemmed by the high growth of the Sephardi (immigrants) and Hasidim(birthrate) communities. Mind you the most recent full Statistics Canada data is from 2011.
__________________
The whole problem with the world is that fools and fanatics are always so certain of themselves, and wiser people so full of doubts. (Bertrand Russell)
Reply With Quote
     
     
  #17  
Old Posted Jan 28, 2021, 7:51 PM
someone123's Avatar
someone123 someone123 is offline
hähnchenbrüstfiletstüc
 
Join Date: Nov 2001
Location: Vancouver
Posts: 33,694
Quote:
Originally Posted by esquire View Post
Seems to me that there is no ideal solution here... either carry on with the existing categories with their shortcomings so that you can have consistency, or shake things up but then good luck looking at long term trends.
You could collect new data in addition to the old categories. They already collect data on language which I think is more informative for some of these groups. Data on mobility and immigration is interesting too.
Reply With Quote
     
     
  #18  
Old Posted Jan 28, 2021, 8:05 PM
dreambrother808 dreambrother808 is offline
Registered User
 
Join Date: Jan 2008
Location: Vancouver
Posts: 4,001
Quote:
Originally Posted by CivicBlues View Post
You mean how White Euro culture completely dominates in other 80% of Canada's towns and cities? Do you hold as much distain for that as you do Vancouver which you claim to be an expert in it's multicultural mosaic, despite the fact you've moved to lily-white "White Rock"?
This sense that the Chinese “dominate” in the ways he describes really doesn’t line up with the reality I’ve experienced living here, which feels much more multi-ethnic. It’s seemingly more of an emotional reaction, an irrational fear of sorts.

In what ways are they dominating the spheres he listed? Political? Look at how white city council is...
Reply With Quote
     
     
  #19  
Old Posted Jan 28, 2021, 11:39 PM
Kilgore Trout's Avatar
Kilgore Trout Kilgore Trout is offline
菠蘿油
 
Join Date: Jul 2001
Location: hong kong / montreal
Posts: 6,137
Quote:
Originally Posted by zahav View Post
Ya some of those designators are off. Abbotsford is over 20% South Asian (the majority of whom are Punjabi) so 3% is not correct. And I don't think Montreal has the largest indigenous population in Canada. The numbers I get on StatsCan are very different, it shows only 34,000 claim part or whole Aboriginal identity in Montreal CMA, vs. 61,000 in Vancouver CMA, 43,000 in Toronto CMA, and 76,205 in Edmonton CMA
That's an example of where things get confusing with the way Statistics Canada categorizes things. All of the numbers I got are from the "ethnic origin" category. The numbers you're citing are from the "aboriginal peoples" category. I have absolutely no idea why there is such a discrepancy.
__________________
¯\_(ツ)_/¯
Reply With Quote
     
     
  #20  
Old Posted Jan 28, 2021, 11:42 PM
Kilgore Trout's Avatar
Kilgore Trout Kilgore Trout is offline
菠蘿油
 
Join Date: Jul 2001
Location: hong kong / montreal
Posts: 6,137
Quote:
Originally Posted by MolsonExport View Post
First Nations proportion. I would have guessed Winnipeg or Regina on top. Way ahead of Montreal. I am surprised.
I was surprised too. I'm not sure how accurate those numbers are. I suspect it may have something to do with people claiming some kind of partial Indigenous ethnicity (eg "my great-grandmother was Huron") but not checking the box that indicates they are First Nations.
__________________
¯\_(ツ)_/¯
Reply With Quote
     
     
This discussion thread continues

Use the page links to the lower-right to go to the next page for additional posts
 
 
Reply

Go Back   SkyscraperPage Forum > Regional Sections > Canada
Forum Jump


Forum Jump


All times are GMT. The time now is 3:09 PM.

     
SkyscraperPage.com - Archive - Privacy Statement - Top

Powered by vBulletin® Version 3.8.7
Copyright ©2000 - 2024, vBulletin Solutions, Inc.