Quote:
California vs. New York: One state's pandemic has been deadlier, but the numbers are more complex than case counts
Erin Allday
July 27, 2020 Updated: July 27, 2020 9:18 a.m.
Their journeys began at about the same time, but California and New York immediately diverged down two very different paths during the coronavirus pandemic.
California started in January, with travelers from China carrying a new virus into the Bay Area. New York was probably only a few weeks behind, its virus arriving from Europe.
From there, California’s trajectory was a gentle upward bend in case counts, a long plateau, and then — the surge. New York’s was the classic curve: a sharp climb in cases followed by a long and bumpy descent.
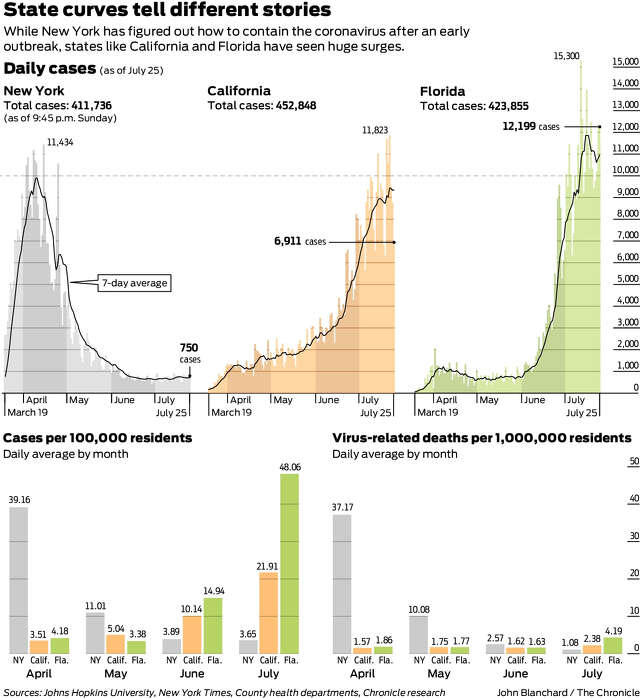
Last week, six months into this pandemic, their paths crossed. California passed New York with the most coronavirus cases in the United States.
That grim convergence occurred as the nation reached its own dark milestone: 4 million reported cases. California, as of Sunday, has about 452,000 cases, to New York’s 412,000. Florida passed New York over the weekend and now has about 425,000 cases . . . .
In March and April, New York consistently reported 10 times as many cases a day as California. By the end of June, California was outpacing New York by about the same rate. Last week, California reported about 65,000 new cases to New York’s 4,900.
But the numbers are more complicated than case counts. California has twice the population of New York, and its infection rate is half that of the Empire State — about 1,100 cases per 100,000 residents compared to 2,100 per 100,000. And New York has more than three times as many deaths — 32,600 to California’s 8,400, an indicator of how hard-hit the East Coast’s hospitals were early in the outbreak and how many more people died as a result.
The numbers are even more nuanced when California and New York are parsed into regions. The Bay Area, for example, has experienced a different epidemic, and is in far better shape, than Southern California. Some rural northern parts of the state have barely been touched by the virus. In New York, it has been Manhattan, along with the other four boroughs and their suburbs, that make up the vast majority of the cases statewide . . . .
In the beginning. The initial trajectory of their curves are fairly well understood. California, the first state in the U.S. to enact widespread shelter-in-place orders in mid-March, shut down ahead of its outbreak. New York acted a little too late.
By the time New York shut down, a large portion of the population in New York City was already infected, public health experts now believe. In the two weeks after Gov. Andrew Cuomo’s statewide shelter-in-place order, confirmed cases doubled every three or four days, and the hospitals were overwhelmed. When the outbreak peaked in the second week of April, more than 10,000 cases were being reported a day and about 1,000 people were dying.
California successfully quashed its burgeoning outbreak. After a gentle uptick in March, daily cases seemed to settle at about 1,000 to 1,500 for a while. They climbed a bit more in May, hitting more like 2,000 cases a day, but still looked stable.
The hospitals were never overrun. The state generally saw fewer than 100 deaths a day. Residents celebrated their “California miracle.” Early, aggressive action had saved the state from the fate of New York and countries like Italy that experienced disastrous outbreaks . . . .
“Even though we’ve flip-flopped in terms of the endpoint and daily new cases, it’s very different here. We were hearing in New York reports of bodies piling up, the social fabric was kind of crumbling. And I haven’t seen that here in California.
New York: the bell curve. An advantage of having a sharp trajectory up is it’s fairly clear when the peak has arrived. In New York, it was in mid April, when the state reported 11,434 cases on what would have been Tax Day. California saw 1,197 cases that day.
From there, the cases fell far and fast in New York. The state reported a daily average of 7,600 cases in April, and 2,100 in May. The average dropped to about 750 cases a day in June and 700 this month.
New York’s curve, now six months into this pandemic, is an elegant bell with a well-defined peak and a long, steady tail.
There’s no one reason why New York’s case count fell so dramatically, but infectious disease experts point to a few most likely explanations. There were probably very few gaps in New York’s shutdown, which primarily affected New York City, the driver of infections. Residents were scared — a few weeks into the outbreak almost everyone knew someone who’d been infected — and therefore obediently quarantined.
Another possible explanation for the drop-off is immunity. By the end of May, one-fifth to one-quarter of people in New York City are believe to have been infected, according to antibody studies. That’s not enough for herd immunity, in which a large enough portion of the population is immune that a virus can no longer find traction to spread.
But if groups of people prone to infection had higher rates of immunity, that could have dampened the outbreak, infectious disease experts said.
California: flattening the curve. California has never come close to that level of community disease. In the Bay Area, only about 1% of people were infected by the end of April, according to a recent Centers for Disease Control and Prevention study. That was the result of flattening the curve.
The state averaged about 600 cases a day in March, then 1,400 in April and 2,000 in May. That’s an obvious increase with the benefit of hindsight, but at the time the numbers appeared flat, day after day. They were even steadier in the Bay Area. There is no doubt, public health experts said, that sheltering in place prevented the massive spike that New York had experienced.
But when it looked like the numbers had plateaued, and as the rest of the country began to reopen the economy, Californians grew complacent and impatient. People in many parts of the state begged for a loosening of stay-at-home restrictions. They also began to socialize again — visiting friends and family they hadn’t seen since March.
Cases began a notable uptick around Memorial Day, and then picked up speed. Californians thought they’d peaked in April, like New York — but it turned out the worst was still to come. The state reported an average of 4,000 cases a day in June — twice as many as May. And 8,500 a day so far in July . . . .
But California’s curve is deceptive, infectious disease experts say, because it’s taken different shapes in different regions. Los Angeles’s trajectory, which has been driving the state curve in recent weeks, was on a slow but steady ascent before a sudden spike in June. In the Bay Area, the curve was notably flat for a long stretch in April and May before trending up.
New York’s pandemic may have been deadlier and more destructive, but it was also more easily contained because it was centralized, Rutherford said. “When you talk about New York State, what you’re really talking about is New York City and the suburbs,” he said. “That makes it simpler.”
California held down its initial outbreak with a blanket shutdown on all 58 counties, but that wasn’t going to be appropriate for the entire state in the long haul, public health experts said. The reopening was blundered, in part, because there was no one approach. “Here, it’s like herding cats,” said Riley.
Both states can learn lessons from the other, infectious disease experts said. California looked to New York’s spike in March and April and knew to bulk up its hospital capacity while its case counts stayed manageable. That knowledge is paying off now as hospitalizations climb to new records.
And New York, perhaps, looked to California’s reopening and saw that a more conservative approach would be best . . . .
|
https://www.sfchronicle.com/health/a...o-15435610.php
I think the statement about the fact that northern and southern CA are two different worlds as far as this epidemic goes is key. In southern CA, in places like Orange County, they are still talking about opening up schools without required masks or distancing of the kids. In Imperial county, it resembles NY with the refrigerated semi trailers holding bodies, largely as a result of conditions to which the huge imnigrant farm worker population is exposed. But at the same time, San Francisco continues with about 7 cases per day per 100,000 population after briefly peaking at about 13 cases per day per 100,000 (even now, New York City is having about 4.1 cases per day per 100,000). In the Bay Area, there is no argument among governments about masking, distancing and the rest. We obviously have individuals who don't follow the rules but the rules themselves are strict and clear.

|