HomeDiagramsDatabaseMapsForum About
     

Go Back   SkyscraperPage Forum > Regional Sections > Canada > Atlantic Provinces


Reply

 
Thread Tools Display Modes
     
     
  #601  
Old Posted Mar 29, 2018, 2:25 AM
JHikka's Avatar
JHikka JHikka is offline
ハルウララ
 
Join Date: Jul 2009
Location: Toronto
Posts: 12,853
Good info, thanks for the maps! Would it be possible to get a listing of the top 5 or 10 sub-districts with the core housing need?

In terms of SJ, I know a lot of the buildings in the North End that are beyond repair are slowly being torn down, and a few others are being renovated. It's an interesting process to see develop and there are, and will be more, lots available for development when that time comes. Great to see some renovation money being put into the neighbourhood where available - some of those buildings are absolutely worth saving but many are definitely fit for demolition.
Reply With Quote
     
     
  #602  
Old Posted Mar 29, 2018, 8:39 PM
Fischbob's Avatar
Fischbob Fischbob is online now
New Brunswick Urbanite
 
Join Date: Sep 2007
Location: Saint John, NB
Posts: 785
As requested, here are the top 10 census tracts for core housing need in NB:

1. 3100010 (South End, Saint John) - 31.5%
2. 3100023 (Old North End, Saint John) - 31.1%
3. 3100007 (Waterloo Village, Saint John) - 30.9%
4. 3100006 (Courtenay Bay public housing, Saint John) - 29.5%
5. 3050006 (Downtown north of Queen/Gordon; St. George Street, area around former Moncton High, Moncton) - 22.4%
6. 3100008 (King Street East area, Saint John) - 21.2%
7. 3100013 (Lower West Side, Saint John) - 20.8%
8. 3050001 (Downtown south of Queen/Gordon; Main Street, Assumption Blvd, Moncton) - 19.7%
9. 3200011 (Northside/Devon area, Fredericton) - 19.5%
10. 3100002.02 (Morland Park, Silver Falls Park and East Side retail district, Saint John) - 18.9%
__________________
“The street is the river of life of the city, the place where we come together, the pathway to the center.” –William H. Whyte

“Forget the damned motor car and build the cities for lovers and friends.” –Lewis Mumford
Reply With Quote
     
     
  #603  
Old Posted Mar 29, 2018, 8:51 PM
JHikka's Avatar
JHikka JHikka is offline
ハルウララ
 
Join Date: Jul 2009
Location: Toronto
Posts: 12,853
Quote:
Originally Posted by Fischbob View Post
As requested, here are the top 10 census tracts for core housing need in NB:
Thanks for this. If I were being really greedy I would ask for %-changes through various census cycles, but i'm not going to be a burden on you.

Surprised North End isn't higher...I suppose recent demolitions lowers its numbers.
Reply With Quote
     
     
  #604  
Old Posted Apr 3, 2018, 12:03 PM
MonctonRad's Avatar
MonctonRad MonctonRad is online now
Wildcats Rule!!
 
Join Date: Jun 2008
Location: Moncton NB
Posts: 34,623
Good CBC article about the demographic apocalypse ongoing in NB

Out-migration cause of low birth rates, says population expert
The province saw its lowest birth rate in 2017 with 6,673 births
Robert Jones · CBC News · Posted: Apr 03, 2018 5:00 AM AT | Last Updated: 3 hours ago
http://www.cbc.ca/news/canada/new-br...ates-1.4602249

Quote:
Elsewhere in Atlantic Canada birth rates have been showing signs of bottoming out but in New Brunswick they continue to tumble — falling 6.3 per cent since 2011, the biggest decline in the country by a wide margin.

Over the same period in the other Atlantic provinces, births are down, but only 2.7 percent and in the rest of Canada, they are up nearly four per cent since 2011.

University of Western Ontario demographer Michael Haan says New Brunswick's problem isn't really about babies, it's about their parents.

"You look at the distribution of the New Brunswick population by age category, and what you see is that there is a bit of a hollow spot right at the age where people tend to have kids," said Haan

In the largest out migration from New Brunswick since the early 1980s, significant numbers of young people moved from the province before and after the 2008 financial crisis, and are now having their children elsewhere.
The problem in the northern part of the province is compounded by in-province migration to Moncton and Fredericton. While these cities are growing, the population in the north is collapsing. In one northern district referred to on the radio broadcast of this article, the population of grade one students is precisely half what the population of grade 12 students is. This is how quickly the collapse is occurring.
__________________
Go 'Cats Go
Reply With Quote
     
     
  #605  
Old Posted Apr 3, 2018, 1:38 PM
JHikka's Avatar
JHikka JHikka is offline
ハルウララ
 
Join Date: Jul 2009
Location: Toronto
Posts: 12,853
Jones' articles are typically pretty pessimistic so i'll save myself the breath, for the most part.

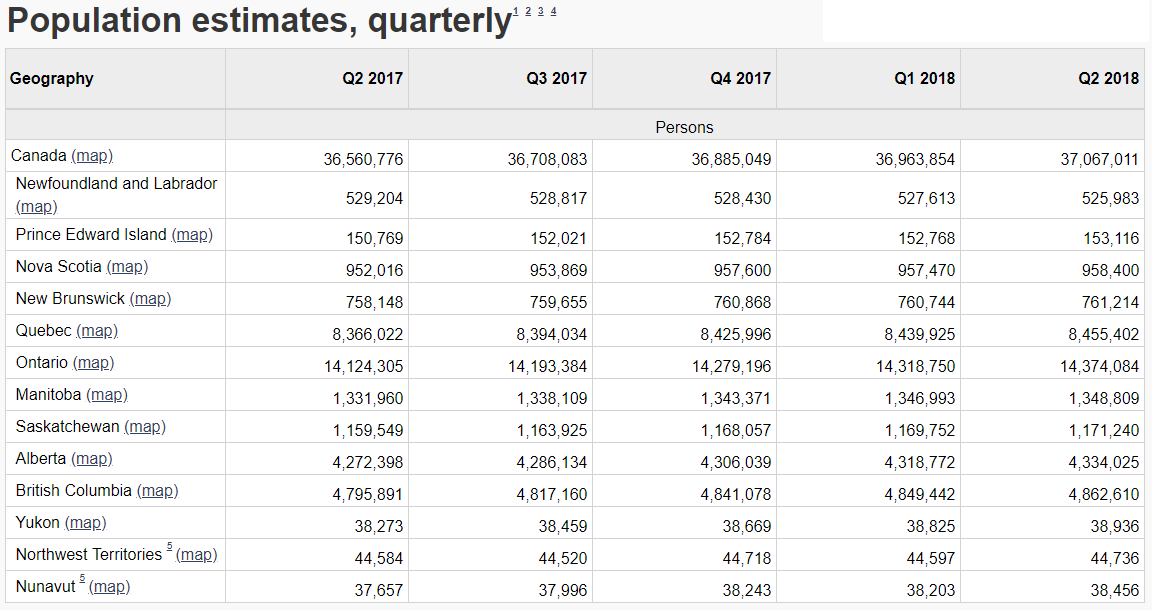
The article fails to mention NB's increasing immigrant cohort or the way that in-migration has been matching out-migration over the past few quarters (according to StatCan's estimates numbers). Instead we get a bleak picture about births/deaths only....he's not wrong about the trending but there's a lack of information on the other hand, too.

Nowhere does it mention that the population has been increasing despite these out-migration numbers, which would sort of defeat the general tone of the article on the whole.

Quote:
Originally Posted by MonctonRad View Post
The problem in the northern part of the province is compounded by in-province migration to Moncton and Fredericton. While these cities are growing, the population in the north is collapsing.
Whenever people talk about a general demographic apocalypse they're mostly seeing NB numbers skewed by Northern NB. I cannot stress enough how much the population in Northern NB is going to decline in the next 20 years. Southern NB (Fredericton/SJ/Moncton & environs) will be mostly unaffected and will likely continue to grow, but areas like Campbellton, Bathurst, Edmundston aren't looking too hot, let alone all of the rural areas surrounding them which will empty out in due time.

Quote:
Originally Posted by MonctonRad View Post
In one northern district referred to on the radio broadcast of this article, the population of grade one students is precisely half what the population of grade 12 students is. This is how quickly the collapse is occurring.
This is almost assuredly Campbellton-Dalhousie, isn't it?

Here's a comparative total enrolment for NB's seven school districts:

2006/2011/2016 enrolment figures:

ENG East 16,287 -> 15,538 -> 15,624
ENG North 10,179 -> 8,569 -> 7,428
ENG South 27,274 -> 24,903 -> 22,969
ENG West 25,920 -> 24,114 -> 22,901

FR Northeast 12,826 -> 10,651 -> 9,520
FR Northwest 6,576 -> 5,678 -> 5,335
FR South 12,951 -> 13,126 -> 14,065

Median Age of NB's CAs/CMAs:
Bathurst: 51.1
Campbellton: 50.4
Edmundston: 50.4
Miramichi 48.3
Saint John: 43.8
Moncton: 42.1
Fredericton: 40.9

Median Age for Census Subdivisions, 2006 -> 2011 -> 2016
Restigouche, 44.7 -> 48.7 -> 51.7
Madawaska, 43.9 -> 47.3 -> 50.1
Gloucester, 44.2 -> 47.9 -> 51.1

Suburban areas and the urban centres in the south have moved from ~40 to ~44 in this same time frame.

Last edited by JHikka; Apr 3, 2018 at 2:13 PM.
Reply With Quote
     
     
  #606  
Old Posted May 11, 2018, 3:49 PM
JHikka's Avatar
JHikka JHikka is offline
ハルウララ
 
Join Date: Jul 2009
Location: Toronto
Posts: 12,853
Not technically stats but some neat satellite images showing the extent of the flooding in Central NB this spring: https://earthobservatory.nasa.gov/IO...w.php?id=92125
Reply With Quote
     
     
  #607  
Old Posted May 12, 2018, 7:25 PM
q12's Avatar
q12 q12 is offline
Registered User
 
Join Date: Mar 2008
Location: Halifax
Posts: 4,526
April 2018 unemployment rates:
  • Nova Scotia 6.7%
  • New Brunswick 8.0%
  • Prince Edward Island 11.2%
  • Newfoundland and Labrador 14.5%

https://www.statcan.gc.ca/daily-quot.../t003a-eng.htm

Quote:
In Nova Scotia, employment increased by 2,700 in April. The unemployment rate continued on a downward trend, falling by 0.7 percentage points to 6.7%, the lowest rate since comparable data became available in 1976. On a year-over-year basis, employment was up 8,000 (+1.8%), largely due to a strong upward trend in full-time employment that began in the autumn of 2017.

https://www.statcan.gc.ca/daily-quot...-eng.htm?HPA=1
Reply With Quote
     
     
  #608  
Old Posted May 13, 2018, 4:29 PM
KnoxfordGuy's Avatar
KnoxfordGuy KnoxfordGuy is offline
New Brunswick booster!
 
Join Date: Jan 2011
Location: Fredericton, New Brunswick
Posts: 1,630
Great news for Nova Scotia! That must mean the unemployment rate in Halifax must be even lower. Seeing that rural numbers usual boost the percentage.
__________________
Fredericton. Noble Daughter Of The Forest.
Reply With Quote
     
     
  #609  
Old Posted May 13, 2018, 5:11 PM
someone123's Avatar
someone123 someone123 is offline
hähnchenbrüstfiletstüc
 
Join Date: Nov 2001
Location: Vancouver
Posts: 33,694
Quote:
Originally Posted by KnoxfordGuy View Post
Great news for Nova Scotia! That must mean the unemployment rate in Halifax must be even lower. Seeing that rural numbers usual boost the percentage.
I suspect some of this variation is just noise from the relatively small sample. The provincial economies don't really lurch from boom to bust month to month as much as the numbers suggest.

But I think it is true that NS and NB have pretty good unemployment rates. Many Canadians think they suffer from rampant unemployment but they are not that different from Ontario, and the cities are no different at all (the main difference is that rural areas make up a larger percentage of the total).

The numbers also show the population in NS growing by 0.7% year over year, NB 0.4%, and PEI 1.5%. So much for the Maritimes being in decline!
Reply With Quote
     
     
  #610  
Old Posted May 14, 2018, 2:46 AM
JHikka's Avatar
JHikka JHikka is offline
ハルウララ
 
Join Date: Jul 2009
Location: Toronto
Posts: 12,853
Month-to-month unemployment numbers are mostly useless to look at in and of themselves. It's better to use a different metric like participation rate, and better to use both in a year-over-year comparison.

Using the table q12 provided:

Year-over-year (April 2017 to April 2018) change in Labour Force:
NFLD -0.9%
PEI +2.8%
NS -0.1%
NB +0.4%

Change in Participation Rate, Year-over-year, April 2017 to April 2018
NFLD -0.4K
PEI +0.9K
NS -0.6K
NB -0.1K

Quote:
Originally Posted by someone123
The numbers also show the population in NS growing by 0.7% year over year, NB 0.4%, and PEI 1.5%. So much for the Maritimes being in decline!
I should note that these percentages are for working age (labour force) population - not total population. It should also be noted that general populations for these provinces are increasing (or in NFLD's case, decreasing) at similar rates. The provinces' populations are not declining despite what the old folks at Tim's might have you believe.

Estimates of Population, Q1 2017 & Q1 2018:
Newfoundland: 530,097 -> 527,613
PEI: 150,271 -> 152,768
New Brunswick: 758,198 -> 760,744
Nova Scotia: 950,990 -> 957,470

Quote:
Originally Posted by someone123
But I think it is true that NS and NB have pretty good unemployment rates. Many Canadians think they suffer from rampant unemployment but they are not that different from Ontario, and the cities are no different at all (the main difference is that rural areas make up a larger percentage of the total).
Here's a good example of this:

Unemployment rate, April 2018, by economic region:
Nova Scotia: 8.4%
Cape Breton: 15.6%
North Shore: 10.1%
Annapolis Valley: 9.3%
Southern: 8.3%
Halifax: 6.3%

New Brunswick: 9.2%
Campbellton-Miramichi: 14.4%
Moncton-Richibucto: 8.2%
Saint John-St. Stephen: 7.1%
Fredericton-Oromocto: 8.5%
Edmundston-Woodstock: 8.4%
Reply With Quote
     
     
  #611  
Old Posted May 15, 2018, 8:48 PM
JHikka's Avatar
JHikka JHikka is offline
ハルウララ
 
Join Date: Jul 2009
Location: Toronto
Posts: 12,853
Table 026-0021
Building permits, by type of structure and type of work
monthly (data in thousands)

Total Residential and non-Residential Construction, value of permits (dollars), seasonally adjusted:

St. John's:
March 2015: 26,710
March 2016: 37,596
March 2017: 21,579
March 2018: 20,606

Halifax:
March 2015: 59,508
March 2016: 42,665
March 2017: 67,894
March 2018: 48,608

Moncton:
March 2015: 19,255
March 2016: 26,634
March 2017: 27,901
March 2018: 19,799

Saint John:
March 2015: 6,293
March 2016: 12,973
March 2017: 13,488
March 2018: 24,749

The $25M in March 2018 is the second highest monthly amount for Saint John (May 2017 is the highest) since these records began in 2011.

Monthly average, total value of permits, residential & non-residential (in thousands):
St. John's
2015: 36,581
2016: 31,682
2017: 35,531
2018: 39,714 (through March)

Halifax
2015: 50,596
2016: 46,261
2017: 79,244
2018: 53,285 (through March)

Moncton
2015: 21,550
2016: 33,669
2017: 31,474
2018: 19,945 (through March)

Saint John
2015: 9,247
2016: 10,072
2017: 21,551
2018: 16,925 (through March)
Reply With Quote
     
     
  #612  
Old Posted May 17, 2018, 12:55 AM
someone123's Avatar
someone123 someone123 is offline
hähnchenbrüstfiletstüc
 
Join Date: Nov 2001
Location: Vancouver
Posts: 33,694
Quote:
Originally Posted by JHikka View Post
Month-to-month unemployment numbers are mostly useless to look at in and of themselves. It's better to use a different metric like participation rate, and better to use both in a year-over-year comparison.
Unemployment isn't useless. A high unemployment rate indicates that there are a lot of people actively looking for work who aren't finding what they want for one reason or another. It is generally better to have lower unemployment.

None of these individual statistics provide a good overall summary of the labour force.

Quote:
Using the table q12 provided:

Year-over-year (April 2017 to April 2018) change in Labour Force:
NFLD -0.9%
PEI +2.8%
NS -0.1%
NB +0.4%

Change in Participation Rate, Year-over-year, April 2017 to April 2018
NFLD -0.4K
PEI +0.9K
NS -0.6K
NB -0.1K
These participation numbers aren't in thousands, they're changes in the rate. And the change in the participation rate was just a fraction of the change in the unemployment rate in NS, so the drop can't just be from people leaving the workforce.

Full-time employment in NS was up by a whopping 2.8%, and the overall employment rate was up by 0.6%. The share of people in NS with full-time jobs was about 1% higher in April 2018 than in April 2017.

I had a look at the CMA estimates (https://www.statcan.gc.ca/tables-tab...fss03a-eng.htm) and it does look like most of the job creation in NS was in Halifax. Moncton likewise saw a big year over year expansion in employment. This doesn't really mean that everywhere else did badly, but it means that the average of the rest of the two provinces wasn't great.

The Halifax CMA has more employment than Newfoundland and Labrador now. Halifax is 235,000 and NL is 223,000. New Brunswick is 355,000.

Halifax has about 46% of the working-age population of Nova Scotia but 51% of the employment. In a few years the majority of people in Nova Scotia will live in the Halifax CMA. It might already be true that more than half of the people in the province live or work in the city.

Last edited by someone123; May 17, 2018 at 1:22 AM.
Reply With Quote
     
     
  #613  
Old Posted May 29, 2018, 11:55 AM
monctonian's Avatar
monctonian monctonian is offline
real estate blogger
 
Join Date: Mar 2009
Location: Moncton
Posts: 47
MLS® Home Price Index

The only Atlantic Canadian market participating at this time is Greater Moncton.
I've been told Nova Scotia could be coming on board later this year.

The MLS® Home Price Index (HPI) is superior to widely published average or median sale prices.

The table below was generated using the HPI Tool

__________________
MonctonGuide.com
Reply With Quote
     
     
  #614  
Old Posted May 29, 2018, 12:14 PM
MonctonRad's Avatar
MonctonRad MonctonRad is online now
Wildcats Rule!!
 
Join Date: Jun 2008
Location: Moncton NB
Posts: 34,623


That's a neat comparison of housing markets across the country (especially in view of the rise in housing prices year over year). It will be good to keep an eye on this in the future.
__________________
Go 'Cats Go
Reply With Quote
     
     
  #615  
Old Posted Jun 7, 2018, 2:19 PM
KnoxfordGuy's Avatar
KnoxfordGuy KnoxfordGuy is offline
New Brunswick booster!
 
Join Date: Jan 2011
Location: Fredericton, New Brunswick
Posts: 1,630
I wonder if there is any way to find out how many Atlantic Canadians are spread out across the country. No way to find out I assume? Half a million?
__________________
Fredericton. Noble Daughter Of The Forest.
Reply With Quote
     
     
  #616  
Old Posted Jun 14, 2018, 1:05 PM
q12's Avatar
q12 q12 is offline
Registered User
 
Join Date: Mar 2008
Location: Halifax
Posts: 4,526
Maritimes population estimate Q2 2018

1,872,730

Atlantic Canada 2.4 Million

Quote:
Canada's population estimates, first quarter 2018

Released: 2018-06-14

Select geography

Quarterly population estimate — Canada

37,067,011


April 1, 2018

0.3% increase

(quarterly change)

Source(s): Table 17-10-0009-01.

Canada's population passes the 37-million mark

According to preliminary estimates, Canada's population was 37,067,011 on April 1, 2018. It took two years and two months for the Canadian population to go from 36 million to more than 37 million. This was the shortest length of time ever observed for an increase of this magnitude. In the first quarter, Canada's population growth rate was 0.3%, up 103,157 compared with January 1, 2018.

International migration is the main source of population growth

From January 1 to April 1, 2018, international migratory increase was 88,120, the highest level ever for a first quarter. Canada received 79,951 immigrants, while the number of non-permanent residents rose by 22,283. The increase in the number of non-permanent residents was attributable to an increase in the number of work permit holders and refugee claimants.

Natural increase in the first quarter was 15,037, or the difference between 93,944 births and 78,907 deaths. Natural increase reached historic lows according to preliminary data, primarily because Canada had never recorded so many deaths in a single quarter. In addition, there are generally fewer births during this time of the year.

Population grows everywhere except in Newfoundland and Labrador

The population grew in every province and territory in the first quarter, with the exception of Newfoundland and Labrador (-0.3%). Nunavut (+0.7%), Ontario and Alberta (+0.4% each) had higher population growth rates than Canada's (+0.3%). Alberta returned to the positive side in its migratory exchanges with other provinces and territories in the last three quarters, following two consecutive years of losses. The province had interprovincial migration gains of 1,862 in the first three months of the year.
https://www150.statcan.gc.ca/n1/dail...098-1&indgeo=0


https://www150.statcan.gc.ca/t1/tbl1...pid=1710000901
Reply With Quote
     
     
  #617  
Old Posted Jun 14, 2018, 1:37 PM
Taeolas Taeolas is online now
Registered User
 
Join Date: Oct 2009
Location: Fredericton
Posts: 3,977
Now if our premiers could cooperate, they should have a 2M population target for the Maritime provinces as soon as possible. I know the number is meaningless, but it is a good psychological goal to reach for.

Hell, I said the same elsewhere, where I suggested Nova Scotia should be pushing hard to reach some round number milestones (I think 1M for the province by 2020 or 2025 or something). New Brunswick has further to go but should be trying hard to grow to the 1M target too, maybe by 2025 or 2030.

Good to see Canada still growing strong. 2 years for 1 M. We'll be 40M before we know it (5-6 years or so easily if we can keep the growth rates). And I only recently shifted my mental thinking from the 30M I grew up with to 35M.
Reply With Quote
     
     
  #618  
Old Posted Jun 14, 2018, 1:46 PM
MonctonRad's Avatar
MonctonRad MonctonRad is online now
Wildcats Rule!!
 
Join Date: Jun 2008
Location: Moncton NB
Posts: 34,623
Quote:
Originally Posted by Taeolas View Post
Good to see Canada still growing strong. 2 years for 1 M. We'll be 40M before we know it (5-6 years or so easily if we can keep the growth rates). And I only recently shifted my mental thinking from the 30M I grew up with to 35M.
When I was born, there were only about 17M people in Canada.
__________________
Go 'Cats Go
Reply With Quote
     
     
  #619  
Old Posted Jun 14, 2018, 1:57 PM
Taeolas Taeolas is online now
Registered User
 
Join Date: Oct 2009
Location: Fredericton
Posts: 3,977
Quote:
Originally Posted by MonctonRad View Post
When I was born, there were only about 17M people in Canada.
24M when I was born. But I don't think the population of Canada 'set' in my mind until high school in the 90's, when it was in the 28-30M range, so that's what I mentally pegged Canada at for the longest time. Granted we didn't reach the 35M point until about 2010 or so, according to Google.
Reply With Quote
     
     
  #620  
Old Posted Jun 14, 2018, 2:10 PM
MonctonRad's Avatar
MonctonRad MonctonRad is online now
Wildcats Rule!!
 
Join Date: Jun 2008
Location: Moncton NB
Posts: 34,623
Quote:
Originally Posted by Taeolas View Post
Hell, I said the same elsewhere, where I suggested Nova Scotia should be pushing hard to reach some round number milestones (I think 1M for the province by 2020 or 2025 or something). New Brunswick has further to go but should be trying hard to grow to the 1M target too, maybe by 2025 or 2030.
Well, if our current growth rate keeps up:

- NB will reach 800,000 in 13 years (2031)
- NS will reach 1,000,000 in 7 years (2025)
- PEI will reach 175,000 in 9 years (2027)

NL needs to pick up it's bootstraps!!

In any event, given current growth patterns, a Maritime population of 2M people might be achievable in about 10 years or so........
__________________
Go 'Cats Go
Reply With Quote
     
     
This discussion thread continues

Use the page links to the lower-right to go to the next page for additional posts
 
 
Reply

Go Back   SkyscraperPage Forum > Regional Sections > Canada > Atlantic Provinces
Forum Jump


Forum Jump


All times are GMT. The time now is 8:03 PM.

     
SkyscraperPage.com - Archive - Privacy Statement - Top

Powered by vBulletin® Version 3.8.7
Copyright ©2000 - 2024, vBulletin Solutions, Inc.