Couple quick points:
1) DC_Denizen, thanks for finding this and posting. Crawford, thanks for finding the Census link. Mhayes, thanks for pointing out some of this differences between deliveries and the Census permit data.
Let's see if we can try to narrow this debate a little.
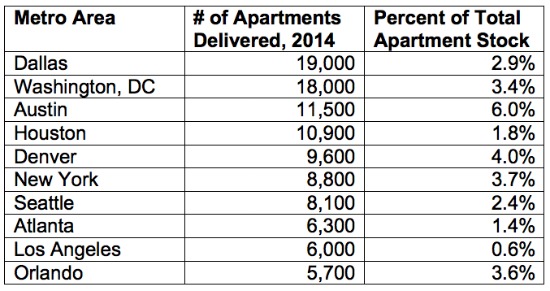
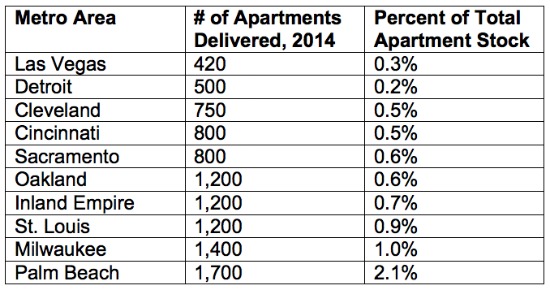
2) This list seems suspect. It show's NYC delivering 8,800 units for a 3.7% supply increase. This implies NYC has 238k apartments. The implied total for Dallas is 655k apartment. Maybe the base is only apartments built in the past 20 years or something, but this makes me a little skeptical of the list.
2) Using the Census permit YTD permit data for December for 2012 and 2013, should give us a rough proxy of activity for 2014. (Yeah, I understand this is not synonymous with 2014 deliveries, but is nonetheless a measure of muti-unit activity).
2012 permits by MSA ranked by number of units in 5+ unit buildings.
Name 5 or more Units 2 or more units
- New York-Northern New Jersey-Long Isl 18063 20137
- Dallas-Fort Worth-Arlington,* TX 15679 15976
- Houston-Sugar Land-Baytown,* TX 14748 14883
- Los Angeles-Long Beach-Santa Ana,* 11666 12486
- Austin-Round Rock-San Marcos,* TX 11117 11249
- Washington-Arlington-Alexandria,* 11000 11382
- Seattle-Tacoma-Bellevue,* WA 8927 9400
- Denver-Aurora-Broomfield,* CO 7923 8156
- Miami-Fort Lauderdale-Pompano Beach,* 7424 7578
- Raleigh-Cary,* NC 6355 6460
2013 permits by MSA ranked by number of units in 5+ unit buildings.
Name 5+ Units 2+ units
- New York-Northern New Jersey-Long Isl 27670 30009
- Houston-Sugar Land-Baytown,* TX 16771 16913
- Dallas-Fort Worth-Arlington,* TX 16503 16945
- Los Angeles-Long Beach-Santa Ana,* 15468 16452
- Miami-Fort Lauderdale-Pompano Beach,* 13226 13416
- Austin-Round Rock-San Marcos,* TX 11509 11911
- Washington-Arlington-Alexandria,* 10862 11028
- Seattle-Tacoma-Bellevue,* WA 10094 10709
- Atlanta-Sandy Springs-Marietta,* GA 9281 9494
- Denver-Aurora-Broomfield,* CO 7987 8291
Sorry for the messy formatting. The first set of numbers is number of units permitted in structures with 5 or more units. This is what the list is sorted by. I also included the figure for those with 2 or more units. The outcome is pretty similar.
Take aways from the Census permit data:
1) Looks like
2 huge MSAs NYC and LA have a ton of permits, not surprising given their size.
2)
Dallas and Houston also lead. Again, not too surprising given their big pop sizes and fast growth rates.
3)
DC is near the top, but not number 2 in either year. Perhaps if we went back to 2011 DC would have scored higher. (Possible, given that DC was among the best performers during and after the recession) But, nonetheless, DC is among the top spots in the nation for multi-family activity. Definitely in league with Seattle and Austin.


 Prev
Prev


 Linear Mode
