 Posted Oct 8, 2016, 8:53 AM
|
 |
Ukrainian moderator
|
|
Join Date: Apr 2005
Posts: 4,602
|
|
all numbers below are counts of any structures that ever existed (built, under construction, on hold and destroyed)
Europe
all drawn % drawn - 3859 2355 61 Germany
- 3397 2600 77 Netherlands
- 2900 2898 100 Ukraine
- 2575 1834 71 Great Britain
- 1616 646 40 Russia {part}
- 1281 416 32 France
- 1263 913 72 Poland
- 1208 439 36 Spain
- 603 518 86 Sweden
- 503 271 54 Austria
- 501 314 63 Belgium
- 481 189 39 Switzerland
- 448 280 63 Italy
- 287 136 47 Lithuania
- 286 171 60 Denmark
- 283 265 94 Latvia
- 251 129 51 Norway
- 227 118 52 Finland
- 221 198 90 Czech Republic
- 215 129 60 Romania
- 163 96 59 Estonia
- 129 42 33 Portugal
- 115 65 57 Bulgaria
- 112 78 70 Slovakia
- 96 36 Croatia
- 92 59 Belarus
- 85 59 Hungary
- 80 15 Monaco
- 71 31 Ireland
- 69 42 Serbia
- 49 39 Greece
- 43 34 Moldova
- 41 15 Bosnia & Herzegovina
- 37 22 Slovenia
- 34 25 Luxembourg
- 29 19 Iceland
- 20 3 Albania
- 15 4 Montenegro
- 15 3 Malta
- 14 0 Kosovo
- 12 12 Macedonia
- 5 5 Andorra
- 2 2 Vatican City
- 1 0 Liechtenstein
- 0 San Marino
Asia
all drawn % drawn - 7951 2735 34 China
- 2609 785 30 Japan
- 1483 668 45 South Korea
- 1350 832 62 Taiwan
- 1029 263 26 UAE
- 1001 119 12 India
- 959 127 13 Thailand
- 796 250 31 Turkey {at SsP listed as Europe}
- 637 96 15 Philippines
- 622 185 30 Malaysia
- 596 179 30 Israel
- 512 157 31 Singapore
- 477 321 67 Indonesia
- 402 110 27 Russia {part}
- 273 27 10 Vietnam
- 239 60 25 Kazakhstan
- 222 47 21 Saudi Arabia
- 165 35 21 Qatar
- 100 3 3 Bangladesh
- 93 63 Iran
- 93 21 Azerbaijan
- 89 20 Kuwait
- 85 3 Lebanon
- 70 8 Bahrain
- 69 18 Iraq
- 68 11 Jordan
- 66 9 Georgia
- 63 28 Pakistan
- 42 19 North Korea
- 33 15 Myanmar
- 30 3 Cambodia
- 25 3 Sri Lanka
- 22 21 Uzbekistan
- 18 4 Mongolia
- 17 4 Turkmenistan
- 14 11 Syria
- 10 6 Cyprus
- 8 4 Brunei
- 7 4 Armenia
- 7 2 Kyrgyzstan
- 6 2 Afghanistan
- 6 2 Tajikistan
- 6 1 Laos
- 2 1 Nepal
- 2 0 Oman
- 1 1 Arabic Palestine
- 0 Bhutan
- 0 Yemen
- 0 East Timor
- 0 Maldives
Africa
all drawn % drawn - 606 124 20 South Africa
- 232 50 22 Egypt
- 140 10 7 Angola
- 85 11 Nigeria
- 81 15 Kenya
- 55 18 Algeria
- 44 14 Morocco
- 37 4 Tanzania
- 31 4 Mozambique
- 29 3 Zimbabwe
- 26 1 Ghana
- 23 4 Ivory Coast
- 22 1 Ethiopia
- 19 3 Botswana
- 18 0 Sudan
- 17 3 Uganda
- 17 0 DR Congo
- 16 8 Libya
- 14 1 Senegal
- 13 0 Namibia
- 11 4 Tunisia
- 11 2 Mauritius
- 7 2 Madagascar
- 6 5 Reunion
- 4 1 Cameroon
- 4 1 Zambia
- 3 1 Mali
- 3 0 Rwanda
- 2 0 Congo
- 2 0 Equatorial Guinea
- 2 0 Guinea
- 2 0 Niger
- 2 0 Sierra Leone
- 2 0 Togo
- 1 1 Liberia
- 1 0 Benin
- 1 0 Burkina Faso
- 1 0 Central African Republic
- 1 0 Swaziland
- 0 Burundi
- 0 Cape Verde
- 0 Chad
- 0 Comoros
- 0 Djibouti
- 0 Eritrea
- 0 Gabon
- 0 Gambia
- 0 Guinea-Bissau
- 0 Lesotho
- 0 Malawi
- 0 Mauritania
- 0 Mayotte
- 0 Sao Tome & Principe
- 0 Seychelles
- 0 Somalia
- 0 South Sudan
North America
all drawn % drawn - 27643 8181 30 USA {part}
- 9107 2543 28 Canada
- 2707 1438 53 Mexico
- 305 90 30 Panama
- 271 64 24 Dominican Republic
- 42 9 Costa Rica
- 41 16 Guatemala
- 25 22 el Salvador
- 24 9 Cuba
- 23 1 Bahamas
- 9 2 Honduras
- 6 4 Greenland
- 2 0 Jamaica
- 1 1 Nicaragua
- 0 Antigua & Barbuda
- 0 Barbados
- 0 Belize
- 0 Dominica
- 0 Grenada
- 0 Haiti
- 0 Saint Kitts & Nevis
- 0 Saint Lucia
- 0 Saint Vincent & the Grenadines
South America
all drawn % drawn - 1787 622 35 Brazil
- 1222 740 61 Argentina
- 446 314 70 Peru
- 357 158 44 Colombia
- 306 136 44 Venezuela
- 195 71 36 Chile
- 117 32 27 Bolivia
- 87 27 Uruguay
- 77 72 Ecuador
- 17 0 Trinidad & Tobago
- 9 0 Netherlands Antilles
- 3 2 French Guiana
- 2 2 Paraguay
- 0 Aruba
- 0 Guyana
- 0 Suriname
Oceania
all drawn % drawn - 2083 649 31 Australia
- 530 83 16 Hawaii {USA state}
- 320 81 25 New Zealand
- 14 0 Guam {USA state}
- 7 2 Papua New Guinea
- 3 0 Northern Mariana Islands
- 2 2 Marshall Islands
- 2 1 Fiji
- 1 1 New Caledonia
- 1 0 Federated States of Micronesia
- 1 0 French Polynesia
- 0 American Samoa
- 0 Cook Islands
- 0 Kiribati
- 0 Nauru
- 0 Niue
- 0 Norfolk Island
- 0 Palau
- 0 Samoa
- 0 Solomon Islands
- 0 Tonga
- 0 Tuvalu
- 0 Vanuatu
top-50 countries- 28187 USA
- 9107 Canada
- 7951 China
- 3859 Germany
- 3397 Netherlands
- 2900 Ukraine
- 2707 Mexico
- 2609 Japan
- 2575 Great Britain
- 2083 Australia
- 2018 Russia
- 1787 Brazil
- 1483 South Korea
- 1350 Taiwan
- 1281 France
- 1263 Poland
- 1222 Argentina
- 1208 Spain
- 1029 UAE
- 1001 India
- 959 Thailand
- 796 Turkey
- 637 Philippines
- 622 Malaysia
- 606 South Africa
- 603 Sweden
- 596 Israel
- 512 Singapore
- 503 Austria
- 501 Belgium
- 481 Switzerland
- 477 Indonesia
- 448 Italy
- 446 Peru
- 357 Colombia
- 320 New Zealand
- 306 Venezuela
- 305 Panama
- 287 Lithuania
- 286 Denmark
- 283 Latvia
- 273 Vietnam
- 271 Dominican Republic
- 251 Norway
- 239 Kazakhstan
- 232 Egypt
- 227 Finland
- 222 Saudi Arabia
- 221 Czech Republic
- 215 Romania
top-40 illustrated countries- 8264 USA
- 2898 Ukraine
- 2735 China
- 2600 Netherlands
- 2543 Canada
- 2365 Germany
- 1834 Great Britain
- 1438 Mexico
- 913 Poland
- 832 Taiwan
- 785 Japan
- 756 Russia
- 740 Argentina
- 668 South Korea
- 649 Australia
- 622 Brazil
- 518 Sweden
- 439 Spain
- 416 France
- 321 Indonesia
- 314 Belgium
- 314 Peru
- 280 Italy
- 271 Austria
- 265 Latvia
- 263 UAE
- 250 Turkey
- 198 Czech Republic
- 189 Switzerland
- 185 Malaysia
- 179 Israel
- 171 Denmark
- 158 Colombia
- 157 Singapore
- 136 Venezuela
- 136 Lithuania
- 129 Norway
- 129 Romania
- 127 Thailand
- 124 South Africa
top-20 most illustrated countries by percentage (with more than 100 structures)- 99,9 Ukraine
- 94 Latvia
- 90 Czech Republic
- 86 Sweden
- 77 Netherlands
- 72 Poland
- 71 Great Britain
- 70,4 Peru
- 69,6 Slovakia
- 67 Indonesia
- 62,7 Belgium
- 62,5 Italy
- 62 Taiwan
- 61,3 Germany
- 60,6 Argentina
- 60,0 Romania
- 59,8 Denmark
- 59 Estonia
- 57 Bulgaria
- 54 Austria
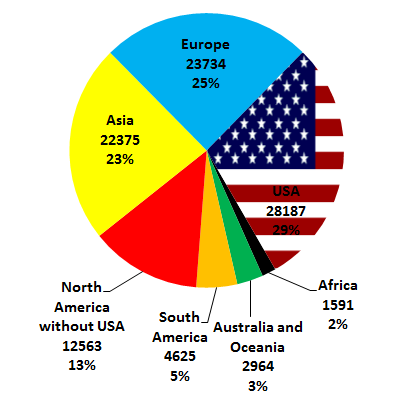
diagram of continents
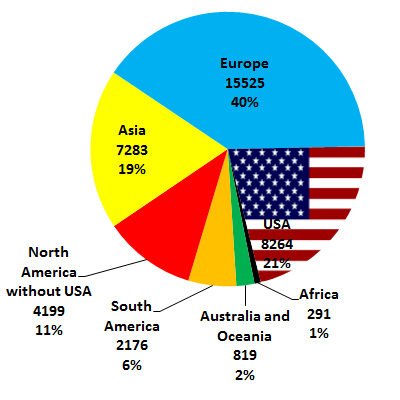
diagram of continents by drawn structures
|